R.0816
Railway braking
During the nineteenth century, inventors tinkered with automobiles and steam locomotives to make them go faster. Few, apparently, worried about how to make them stop. Early cars had no brakes on the front wheels, and in the 1840s, many steam locos capable of 60 mph had no brakes at all [26]. It seems that people were excited by the prospect of speed but less concerned about what might happen if things went wrong, and it took several major accidents to convince them of the risks involved. Eventually it became clear that for a railway, effective brakes and a rigorous form of control were needed to prevent runaways and keep vehicles a safe distance apart. Today, on a conventional network it is braking performance that determines the key parameters of the signal system. The signalling system in turn determines the number of trains that can be in circulation at any given moment, and ultimately the number of passengers that the line can carry. Better brakes mean that more people can travel. In what follows, we shall see how braking systems have developed over the last 100 years, and where current efforts seem to be leading.
Categories of brake
A moving vehicle has kinetic energy, which must somehow be removed to make stop. For a vehicle of mass \(m\) travelling at speed \(v\), its value is equal to \(\frac{1}{2}mv^{2}\). If you want a visceral sense of what this means for a high-speed train, the calculations set out in Appendix 1 show that the kinetic energy for a train moving at 350 km/h has a value equivalent to the work needed to lift it vertically a distance of 482 m above the track. Imagine the destruction it would cause if the train were lifted bodily to a height of half-a-kilometre and allowed to fall onto some nearby buildings.
Figure 1

There are several different ways of dissipating energy that engineers have exploited to make trains stop safely. The important ones are listed in table 1. Some operate on the wheels, the idea being that if you slow the speed of rotation, you’ll slow the vehicle, assuming there is adequate friction between the wheels and the rails (figure 1). These are referred to as adhesion dependent systems. Adhesion-dependent devices can be broken down further into two categories. We are all familiar with friction brakes such as bicycle calliper brakes and automobile disk brakes, which use friction to turn kinetic energy directly into heat. Dynamic brakes involve the creation of electrical current or fluid turbulence to carry away the kinetic energy in some other form before it is dissipated. The other main category consists of non-adhesion dependent devices that don’t operate through the interface between the wheel and rail, but directly on the rail or the surrounding environment (figure 2).
Figure 2

| Mode of action | Method | Device |
|---|---|---|
| ADHESION DEPENDENT | Friction on wheel | Tread block |
| Disk brake | ||
| Non-friction | Rheostatic brake | |
| Regenerating brake | ||
| Hydro-kinetic retarder | ||
| OTHER | Track brakes | |
| Aerodynamic brakes |
Tread brakes
During the age of steam, all trains relied on the friction produced by cast-iron brake shoes or blocks pressing on the wheel treads to slow the vehicle down. How hard must a brake shoe press? If you think of the brake shoe pressing on one part of the tread, and the rail surface pressing on another part, you’ll see there are two friction processes going on here: one between the shoe and the tread, which slows down the wheel, and one between the wheel and the rail, which is the force that actually retards the train. Since the coefficient of friction in both cases is of a similar order, the friction force \(F\) supplied by the shoe on the tread must be around the same as the retarding force \(Q\) that is required to slow the train (figure 3), so it was necessary for each brake shoe to press on the wheel rim with a force \(N\) at least equal to the load \(P\) carried by that wheel, which for a steam loco was around 11 tons [22]. The shoe was located ahead of the wheel below the axle centreline, attached to a hanger suspended almost vertically from a pivot on the vehicle frame. It was connected to a piston and cylinder powered by steam pressure, air pressure, or a vacuum. For vehicles with steam-powered brakes or air-brakes, there would be a separate piston and cylinder attached to each brake hanger, or a single piston and cylinder operating the two hangers attached to each wheelset. Many UK steam locomotives used a vacuum system, and because the vacuum cylinder was relatively bulky the brakes for all the axles on the locomotive were powered by a single cylinder and piston, the shoes being connected to the piston via cross-beams and longitudinal pull-rods [23] as shown in figure 4. The geometry of the rodding was arranged to amplify the force generated by piston using the principle of the lever, and multiple linkages were used to equalise the forces on each wheel: a good illustration of one particular layout can be found in [24].
Figure 3
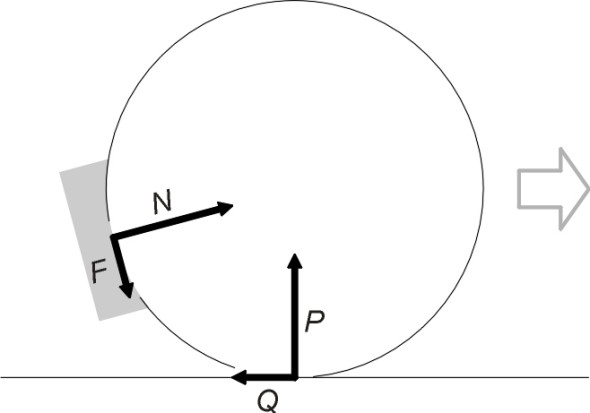
Figure 4
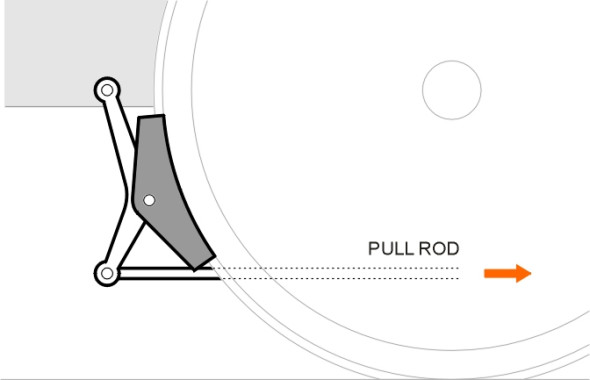
On freight wagons, tread brakes with cast iron shoes wear out roughly within a year [2]. When used on certain electric locos in the UK [16], they had to be renewed every 7 or 8 days! They are still used on older freight wagons (nowadays actuated by compressed air), but the shoes tend to roughen the tread surfaces, thereby raising the noise level by about 10 dbA [12] and potentially causing wheel corrugations. Operators are therefore switching to synthetic materials. But for passenger vehicles, disk brakes are much better.
Disk brakes
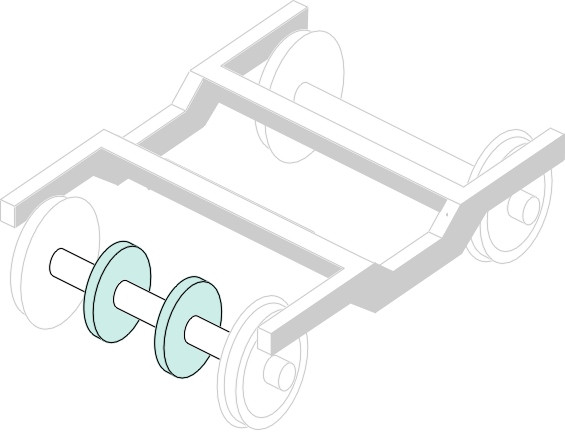
The disk brake is a powerful and efficient way of applying friction to slow down a vehicle wheel. It was originally developed for aircraft, where its light weight, freedom from distortion at high temperatures, and its ability to dissipate heat quickly so it didn’t damage the pneumatic tyre gave it a considerable advantage over drum brakes. It was later applied successfully to automobiles, and finally to railway vehicles in the latter half of the 20th century. You might imagine that a steel railway wheel could itself act as the disk and one would need only to fit the calliper over the rim to create a perfect disk brake. But standard railway wheels are not designed to cope with the heat produced in sustained braking, and in practice, most trailer bogies have separate disks keyed onto the axles (figure 5) between the wheels inside the bogie frame, and each disk is actually a pair of disks separated by vanes that provide continuous ventilation. However, for power bogies the situation is more difficult. There is not much room for disks inside the frame because of the motors and gear drives, and an alternative solution is to bolt a friction plate on either side of each wheel to provide the wearing surface. This was the solution adopted for the Shinkansen N700 design [1].
Figure 5
Rheostatic brakes
Disk brakes are powerful but they generate heat within a confined space inside the bogie frame that will accumulate on a long downhill grade and potentially damage the running gear. The rheostatic brake overcomes this problem neatly. You’ll be familiar with the idea that an electric motor is a device that when supplied with electric current will produce motion. And that it also works in reverse: if you drive the motor spindle from an external source, it will produce electricity. This is the principle behind the rheostatic brake, as used for example during the 1970s on the Class 86 electric locomotives in the UK [14]. It works only for power bogies, not for ‘trailer’ bogies where the wheels aren’t connected to a motor. The current is directed into a resistor array where it turns into heat. The array is often located on the vehicle roof where it can dissipate heat more easily into the atmosphere, and in this way, it’s possible to remove 2 MW during an emergency braking sequence [17]. As the main braking system the rheostatic brake has two advantages over other devices. Firstly, there is no mechanical wear-and-tear, and secondly, it’s possible to arrange for the output current to be returned to the supply wire. A braking process that recycles energy this way is called regenerative braking. However rheostatic braking does not work at low speeds, and a conventional braking system is needed to bring the train to a halt and also to act as a parking brake.
Regenerative braking sounds like a good way of saving fuel, but it is not easy to realise the saving on a mainline railway. Most mainline systems have an AC supply, which in many cases is converted on board to DC to power the motors. Hence any surplus motor power has to be converted back to an AC wave form before it can be returned to the contact wire. Also, power returned to the wire can only be used if there is another vehicle drawing power nearby. Otherwise it will be dissipated through resistance, which can cause a local build-up in voltage and trip the relays that protect the ‘donor’ vehicle. This will disconnect the vehicle from the power supply and deprive it of braking effort. Hence back-up rheostats must be provided [4].
Other brakes
Another way to dissipate kinetic energy is to connect each wheelset to a turbine or similar hydraulic device that churns up a liquid. Turbulence in the liquid is then dissipated as heat. The heat is removed by circulating the liquid through a cooling system. The liquid is usually oil, of the kind used in torque converters on automobiles fitted with automatic gearboxes (although during the 1970s, British Rail experimented with water on the prototype Advanced Passenger Train). The only drawback with a hydro-kinetic system of this kind is that the energy is dissipated into the atmosphere and can’t be re-cycled.
Finally, we should mention two categories of braking system whose potential is still being explored: aerodynamic brakes and track brakes. We have already come across them in Section G0816. An aerodynamic brake can be any device that interferes with smooth air flow along the surface of a moving vehicle. In 2005, the East Japan Railway Company experimented with retractable ‘spoilers’ fitted to a prototype tilting train. Shaped like fins, they were retracted inside the body shell until needed for braking. Generally speaking, aerodynamic brakes work only at high speeds, but on the other hand they don’t overheat and they don’t wear out. In sharp contrast are the track brakes that today are widely used on urban trams. They are intended for use only at low speeds but they are essential for operating in a street environment where a tram must be capable of a sudden stop. Since the friction between wheel and rail is limited to 0.25 (less in wet weather) the maximum deceleration rate is \(0.25 g\), rather less than the \(0.5 g\) - \(1.0 g\) typical of cars and buses. The solution is to grip the track very hard with steel shoes. The brake shoe takes the form of a narrow steel block about 350 mm long that contains an array of powerful electromagnetic coils. It is normally held by springs about 10 mm above the rail surface. When the brakes are applied, the coils are energised so they overcome the resistance of the springs and the shoe is drawn onto the rail with considerable force (60 kN in the case of the Manchester Metrolink trams [25]). Track brakes must be battery-powered in case the overhead supply fails, and they are used only during emergency stops otherwise they would quickly wear out the track.
But a track brake doesn’t necessarily have to press on the rail surface. An alternative device called the eddy current brake is built up from a series of electro-magnetic pole pieces, positioned with a small gap between the underside of the shoe and the rail surface so there is no physical contact and no wear. The electro-magnets set up eddy currents within the rail and the eddy currents in turn set up a magnetic field that opposes motion of the shoe relative to the rail. The system only works when the train is moving but it can provide an appreciable share of the braking effort during the early part of a braking sequence when the speed of the train is still above 200 km/h [11]. It has been applied to the German ICE3 high-speed trains: the train set carries a total of eight units each supplying a braking effort of 22.5kN per unit, giving a total of 180kN, about half the amount needed to achieve a deceleration of \(0.09 g\). The other half is provided by rheostatic brakes. Eddy current brakes require energy input and the heat that they generate can damage the rails, but compared with disk brakes they are relatively compact and light in weight.
Braking performance
Many people believe that the railway train is the vehicle of the future, a paradigm of advanced technology capable of much higher speeds than the most expensive supercar. Yet trains don’t stop very quickly. The deceleration rate is normally less than \(0.1 g\), compared with \(0.5 g\) for a passenger car. There are three reasons for this, none of which have anything to do with the quality of the brakes as such. The first is that railway passengers expect to move about inside the train without being disturbed by inertial forces, and a passenger who falls over could well be injured. The second reason is that the coefficient of friction between the wheel and the rail is relatively small, and the driver must allow for unexpected variations owing to moisture or detritus on the rail surface. The third concerns heat dissipation, an issue to which we’ll return later.
Braking distance
On modern railways the limit for deceleration in normal operation - known as ‘service braking’ - is set at a modest level, between 0.5 and 1.3 m/s2 [5], equivalent to \(0.05 g\) to \(0.13 g\) (the figure used for the first generation of high-speed trains in the UK was \(0.09 g\) [15]). Emergency braking is a different matter. If something unexpected happens the driver must attempt the highest possible rate of deceleration using all the frictional resistance that can be extracted from the braking system and the track. But the value will depend on the state of the rail surface and therefore weather plays an important part, as does the vehicle speed. Earlier in Section G0816, in order to make a comparison of emergency braking with other modes we assumed a value of \(0.2 g\), about twice the value for service braking.
While the rate of deceleration is important from the passenger’s point of view, what matters to the railway operations manager is the distance required to stop. One can visualise the stopping distance as made up of two components. The first arises from the delay while the driver makes the decision to brake and moves the brake handle, plus the time required for the braking action to take full effect. The second is distance required to come to a halt under full braking. Since it accounts for much the greater proportion of the total, in what follows we’ll concentrate on the second component and refer to it as the braking distance. Let’s call it \(s\). To work out the braking distance for any vehicle it’s convenient to assume that the rate of acceleration \(a\) is constant throughout (note that since the train is slowing down the value of \(a\) will be negative). We can then use the well-known ‘constant acceleration formula’ in which \(u\) represents the initial speed, \(v\) the final speed, and \(x\) the distance travelled:
(1)
\[\begin{equation} v^2 \quad = \quad u^2 \; + \; 2ax \end{equation}\]If we put \(x = s\) and \(v = 0\) in equation 1 and re-arrange it we get:
(2)
\[\begin{equation} s \quad = \quad - \frac{u^2}{2a} \end{equation}\]The formula tells us that assuming the rate of deceleration is held constant at \(0.09 g\), when braking from 100 km/h, a train will need nearly half a kilometre to stop. And if the speed doubles to 200 km/h the stopping distance will increase by a factor of four, to nearly 2 kilometres.
Empirical formulae
So what happens in practice? Many railway operators use formulae inherited from the period before high-speed trains came into being, most of which assume a constant rate of deceleration so that the braking distance is proportional to the square of the speed as specified in equation 2. Some examples are described briefly in [19]. But the formulae take into account other factors that we haven’t so far mentioned, including (a) the gradient and (b) the braked weight percentage\(\; \lambda\). The latter calls for some explanation. Using a standard set of 15 passenger coaches, in 1938 the French railway engineer Pedeluc carried out a series of experiments to measure the braking distances required to halt the train from various initial speeds under emergency braking. He then disconnected the brakes on some of the coaches and repeated the experiment, thereby simulating the performance of a train whose brakes were less effective than those of the standard train. In each case the reduced braking effort was characterised in terms of \(\lambda\), defined as the proportion of the total train mass supported on braked axles. For example, if in a particular test the brakes were working on only half the coaches, the value of \(\lambda\) was recorded as 0.5. The aim was to develop a simple method for comparing any railway vehicle with the standard vehicle as a yardstick, whose \(\lambda\)-value by definition was 1.0.
Figure 6
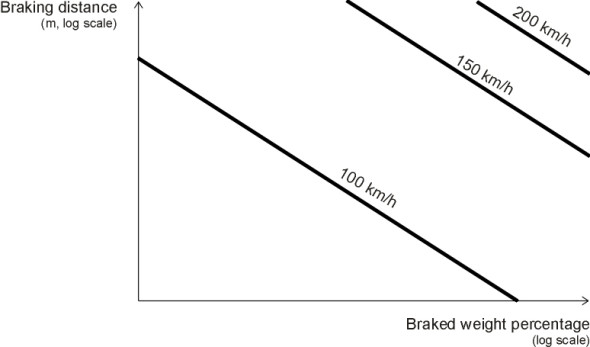
The resulting braking distances were plotted on log-log paper to yield curves of braking distance against braked weight percentage, each curve corresponding to a different initial speed, as shown diagrammatically in figure 6. The graphs could then be used to characterise the braking performance of any given train in terms of the braked weight percentage alone. This was done by measuring the braking distance for that train at a particular speed and reading \(\lambda\) off the graph for the speed at which the measurement was made. This was a very convenient method for representing the whole gamut of braking performance for any chosen train in terms of a single number, and it is still used today not least because it simplifies harmonisation of railway operation across national borders within Europe. However, it relies on the assumption that the braking distance for all trains varies with speed in the same way, in other words, the profile has the same shape apart from a scaling factor that is unique to each vehicle type. If we label the trains \(i = 1, 2, 3,\ldots\), mathematically, this condition can be expressed as
(3)
\[\begin{equation} s{_i} ( u ) \quad = \quad k_{i} f ( u ) \end{equation}\]where the scaling factor \(k_i\) may vary from train to train but is independent of initial speed, and the function \(f (u)\) is the same for all trains. In the 1930s, this condition was met by virtue of the cast iron shoe brakes in use at the time, which generated a frictional resistance that did not vary significantly with vehicle speed [18]. Hence during any given test the acceleration was constant throughout the braking sequence, the braking distance was proportional to \(u^2\), and equation 3 was satisfied.
As we shall see shortly, however, the situation is different for high-speed trains, inasmuch as the deceleration rate is far from constant. This does not necessarily rule out the possibility of using the braked weight percentage to characterise braking performance because in theory, equation 3 might still hold. But even if this were the case, the value of \(\lambda\) on its own conveys limited information. It tells you the overall braking distance, but says little about what happens during the process. In principle, a driver could adopt one of any number of strategies in which the intensity of braking varies from moment to moment until the train stops. The braking pattern is usually portrayed in the form of a graph, a plot of speed against distance travelled, known as a braking curve. Let’s look at two simple models.
Two theoretical braking curves
For each of the two models we’ll consider how the distance travelled \(x\), the instantaneous speed \(v\), the acceleration \(a\) and the rate of energy dissipation vary throughout the braking sequence. The braking process starts at time \(t = 0\). Distance \(x\) is measured along the track from the point where the braking process starts, and the braking sequence ends when the train comes to a halt at \(x = s\). The calculations are set out in Appendix 2 at the end of this Section. To simplify comparisons between the models, the quantities concerned will be plotted as dimensionless variables defined as shown in table 2.
| Dimensionless variable | Definition | |
|---|---|---|
| Distance \(X\) | \(x/s\) | where \(s\) is the distance required to stop under constant acceleration |
| Time \(T\) | \(t/t_{c}\) | where \(t_{c}\) is the time taken to halt in the constant acceleration case |
| Speed \(V\) | \(v/u\) | where \(u\) is the initial speed |
| Acceleration \(A\) | \(a/a_{c}\) | where \(a_{c}\) is the acceleration in the constant acceleration case |
In the first model we assume a constant rate of acceleration \(a = a_c\) throughout, so that \(A = 1.0\). This implies a constant retarding force and therefore the minimum friction coefficient required between the wheels and the rails is constant too. The dimensionless distance \(X\) is plotted against dimensionless time as the black curve in figure 7. Dimensionless speed and dimensionless acceleration are plotted against \(X\) as black lines respectively in Figures figure 8 and figure 9. As shown in Appendix 2, it turns out that the train dissipates equal amounts of kinetic energy for equal increments of distance travelled, so that if it is all converted into heat, the heat load is distributed evenly into the surrounding air at different points along the track. This might be important in the close confines of a railway tunnel.
Figure 7
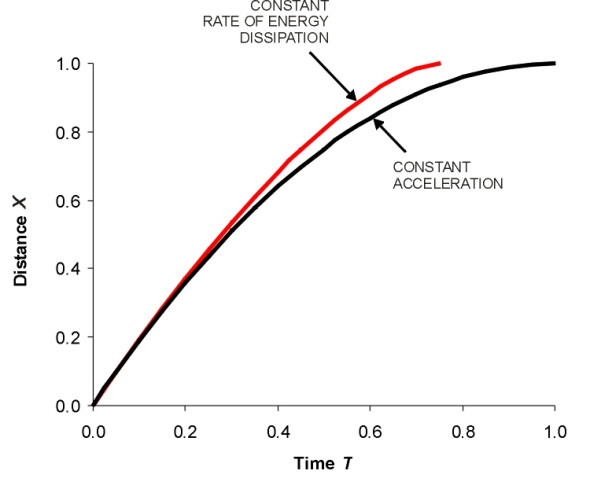
Figure 8
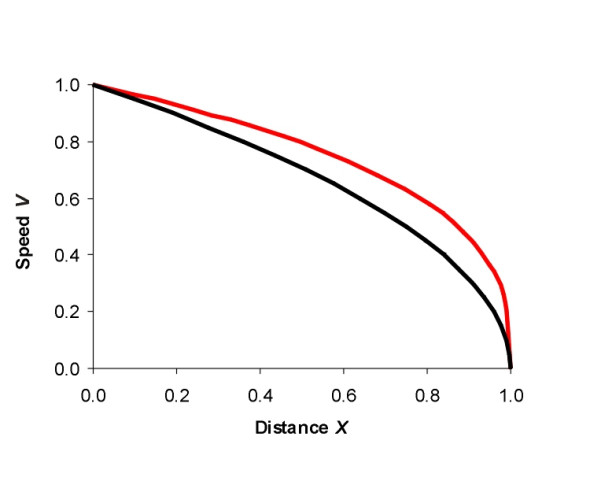
Figure 9
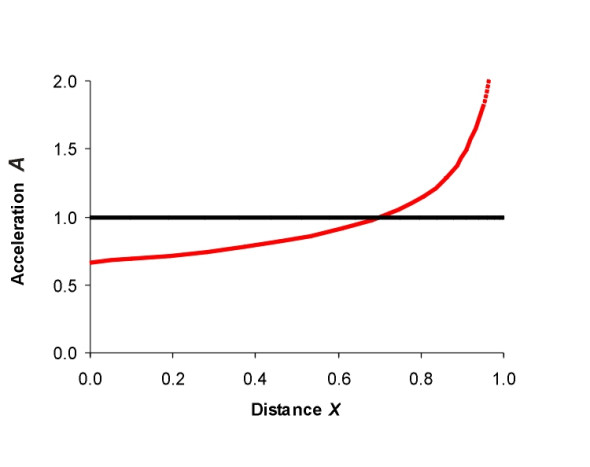
In the second model the rate of acceleration is not constant, but controlled in such a way that the train’s kinetic energy is dissipated at a constant rate over time: equal amounts of heat are generated in equal time intervals. We stipulate that the braking distance \(s\) is the same as before. The results are set out in Appendix 2, and they show that the train stops at an earlier time than it would do under the constant acceleration model. Profiles of the dimensionless distance, speed, and acceleration appear as red lines in the accompanying Figures. Figure 7 confirms that the train stops earlier, in just three-quarters of the time taken in the constant acceleration case. But the speed is greater throughout (figure 8), and the train slows more abruptly towards the end of the braking sequence. In fact the acceleration approaches minus infinity as the train comes to a halt (figure 9). Therefore at some point, the braking force demanded between the wheels and the rail must be greater than the available friction, the wheels will lock, and the train will overrun the stipulated braking distance. In order to work satisfactorily, the constant dissipation model would need to be modified with a reduced intensity of braking during the later stages that takes into account the friction constraint.
But these two models are not the only possibilities. They both entail sudden changes in acceleration - infinite ‘spikes’ in the jerk profile - that are undesirable from the passengers’ point of view (you’ll recall that jerk\(\,\) is a technical term for the rate of change of acceleration: see Section G0216). In theory, we could minimise disturbance to passengers by dividing the braking sequence into two equal time intervals in which the jerk level is maintained at a steady constant negative level in the first interval and a steady positive level in the second. Hence the acceleration intensifies linearly from zero to a (negative) peak, and then declines linearly again to zero at the moment the train stops. Unfortunately, this ‘passenger-friendly’ model has the effect of increasing the braking distance. If we stipulate for example that the acceleration peaks at the same value \(a\) as in the constant acceleration case, it’s possible to show that the braking distance is doubled, but we haven’t given the derivation here.
High speed trains
The constant acceleration model is often used in text books as a basis for understanding what is required from a braking system and how it performs. In the case of an emergency stop, this is not unreasonable. If you want to halt a train in the shortest possible distance, then the limiting factor is the friction between wheel and the rail. Assuming that the brakes are sufficiently powerful to use all the available grip, and the coefficient of friction is constant throughout the braking process, then a constant (negative) acceleration is the most effective strategy. In practice, however, the friction is not constant, but falls appreciably at high speeds, so in order to avoid locking the wheels and damaging the tread and rail surface, the braking effort must start at a somewhat lower level and build up to a maximum later on as shown in the upper part of figure 10.
Figure 10
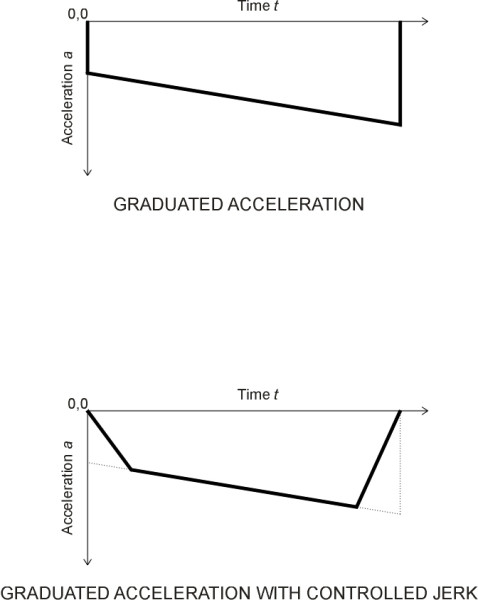
Figure 11
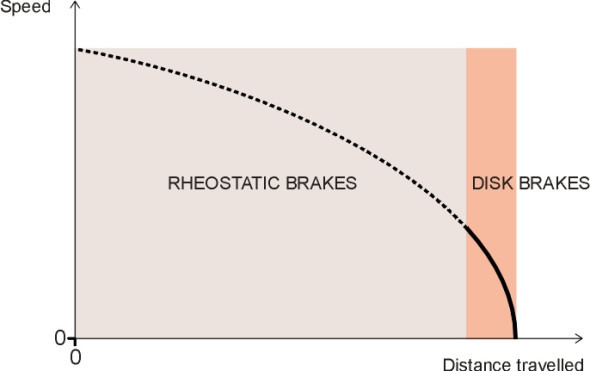
And as we have seen, for an ordinary service braking scenario, there are other factors to be taken into account, in particular, passenger comfort and energy dissipation. To avoid disturbing passengers with a ‘spike’ in the jerk level, rather than starting with a sudden application of braking effort, we want to build up to the required intensity over a finite time period. Similarly, we want the brakes to be released gradually to avoid a spike just as the train comes to a halt (an experienced car driver will do this instinctively, although a gradual release is harder to achieve than a gradual application). The designer of a high-speed train must also decide how to manage the heat dissipation process. With any braking system, there is a limit to the rate at which heat can be removed from the braking apparatus and conveyed to the surrounding atmosphere, and the intensity of braking must be regulated so that surface temperatures and the rate of heat flow lie within the range that the materials can handle. With the constant acceleration model, the rate of heat dissipation is not constant over time: as shown in Appendix 2, it peaks at the beginning of the braking sequence and falls linearly until the train stops. The uneven heat load can cause serious problems for disk pads, and consequently, high-speed trains usually have two separate braking systems. Initially, a rheostatic brake carries most of the burden, dissipating heat from the roof-mounted resistors, and because of the reduced wheel grip the rate of deceleration is comparatively modest. The disk brakes take over when the speed has fallen to a comparatively low level (figure 11). They are both controlled by a microprocessor that continually assesses the braking distance required given the vehicle’s location and speed, and works out a sequence in which the two types of brake are brought into action [10]. The result is that the overall braking distance \(s\) is no longer proportional to the square of the initial speed and in fact increases more rapidly than \(u^2\). Travelling at 350 km/h, a high-speed train today will need several kilometres to stop.
Brake actuation
The wheels of a railway train don’t grip the rails very well, so it’s important that all the axles have brakes that contribute to the stopping power. It’s vital too that the brakes along the whole length of the train are applied at more-or-less the same time, and with the minimum delay. This is not as easy as it sounds, because almost all trains rely on the air pressure within a continuous pneumatic brake pipe to trigger the individual brake units from the driver’s cab. For a freight train, the ‘signal’ can take 30 seconds to run the length of the train, and the signal that releases the brakes takes longer [6]. It may seem odd that such a crucial operation takes place through mechanical apparatus rather than an electronic circuit, and in order to find out why, we must trace its evolution from the earliest days of the steam locomotive.
Vacuum brakes
On steam trains and their rolling stock (coaches and wagons) the brakes consisted of iron shoes pressed against the wheel tread, with the braking force supplied by a cylinder and piston and transmitted to the wheel by a horizontal pull-rod as shown earlier in figure 4. The shoes must press with considerable force, and for locomotives and tenders, there was a convenient source of power in the boiler: steam, which could be admitted into the brake cylinder through a valve. But steam power could not be harnessed for braking the wagons or coaches on a train because it would cool and condense in the brake pipe before reaching its target. The only options were air pressure or vacuum.
Vacuum systems were developed in the UK but were not much used in mainland Europe. The vacuum was generated using the same principle as the steam injectors used to draw water into the locomotive boiler: you force a jet of steam through an aperture and it sucks in air from a side-passage leading to the vacuum pipe (the technical expression is ‘entrainment’), leaving a reduced pressure in the pipe. The vacuum pipe was about 50 mm in diameter, and ran the length of the train, linking the ejectors to the brake cylinder at each wheelset. In the early ‘simple system’, when the driver activated the steam ejector, the pressure in the vacuum pipe fell and unbalanced air pressure acting on one side of the piston in each brake cylinder forced the brake shoe onto the wheel (figure 12). The system didn’t act very quickly and would fail completely if a rupture occurred at any point in the pipe [20].
Figure 12
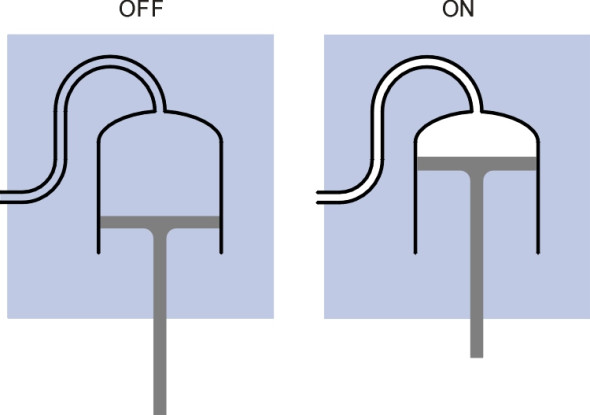
Figure 13
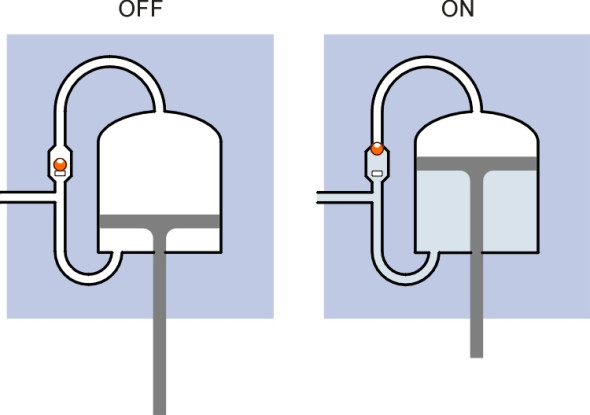
Eventually, triggered by a horrific disaster near Armagh in 1889 [20], a much safer variant of the system was introduced in the UK, known as the Gresham Automatic system. The vacuum was maintained continuously in the brake pipe throughout each journey via a reservoir on the engine, and the brake pipe was connected both to the upper chamber and the lower chamber of each cylinder as shown in figure 13 so that under normal conditions, the pressure on both sides of the piston was the same. However, the connection to the upper chamber included a non-return ball valve. The weight of the piston and associated linkage to the brake shoe ensured that the shoe was held in the ‘off’ position. When the driver applied the brakes, the vacuum in the lower half of the cylinder was cancelled by allowing air into the brake pipe. But the ball valve prevented air flow into the upper chamber, so that the piston was forced upwards and the brake shoe applied to the wheel tread. Hence the system worked in the opposite sense to the simple system, with the result that the braking action took place more quickly and the whole was ‘fail-safe’: if a leak occurred or the brake pipe ruptured, all the brakes came on automatically. Note that figure 13 is a simplified representation of the apparatus as developed in its mature form, which was modified to speed up the operation further. The attraction of the vacuum brake was that the pump that supplied the vacuum - the steam ejector - had no mechanical parts and there was little to go wrong. Ultimately, however, in those countries where it was used the vacuum brake gave way to the pneumatic or ‘air brake’ for the simple reason that the maximum pressure that could be applied to the piston was limited to atmospheric pressure (actually a good deal less in practice) and to achieve a large braking force the diameter of the piston had to be quite large. Vacuum cylinders were cumbersome - and could only be used on steam trains.
Air brakes
By comparison with a vacuum system, a compressed air system could provide much a larger braking force with a given diameter of cylinder and train pipe, and it could be driven by a steam engine, a diesel engine, or an electric motor. The operating principle was broadly the same, with a continuous pipe connecting all the coaches or wagons in the train. The idea could have been conceived by any number of inventors who were attracted to the railway industry during the nineteenth century, but making it work was a different matter. Fortunately, the air brake benefited from the attentions of an exceptionally gifted engineer. In 1869, at the age of 22, George Westinghouse created a working system for the Panhandle Railroad in the USA, and the story is often told of an experiment in which it was fitted to a 3-coach train for demonstration to the company directors. During one particular run, a horse and rider strayed onto the track, and the train was brought to a halt with a little over a metre to spare. This greatly impressed the company directors and the demonstration made the inventor’s name. He went on to found the Westinghouse Air Brake Company (WABCO) that has since become a world-wide concern. During his lifetime, Westinghouse took out over 3000 patents, and was awarded many international honours. Among his achievements were the development of electrically powered turnouts and signalling systems, the creation of utility companies, contributions to automated telephony, and air springs for cars.
The air brake first evolved as a ‘simple system’ for steam trains. The power source was a pump driven by steam from the locomotive boiler. The pump filled a reservoir with compressed air. When the driver moved the brake lever, a valve released the compressed air to be distributed along the train pipe to the brake cylinders, one for each vehicle in the train. The working pressure was around 100 lb/in2 (700 kPa), compared with the theoretical maximum of 14.7 lb/in2 (100 kPa) for a vacuum brake. The piston in each brake cylinder in turn activated the brake shoes by a system of levers in a manner similar to that used in the vacuum system. Like the earliest version of the vacuum system, the simple air brake suffered from the disadvantage that if any of the vehicles became separated the whole system lost power and the brakes were useless. It was also slow to act, because the compressed air took an appreciable time to reach the last vehicle in the train.
Figure 14
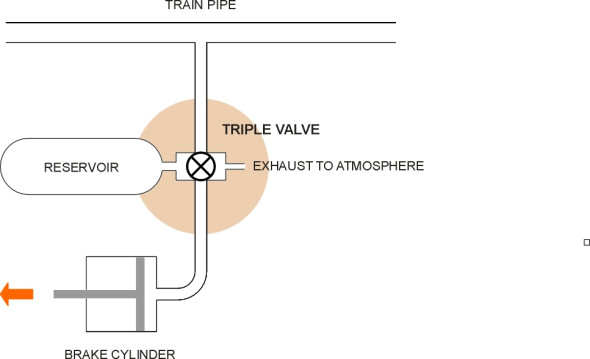
Figure 15
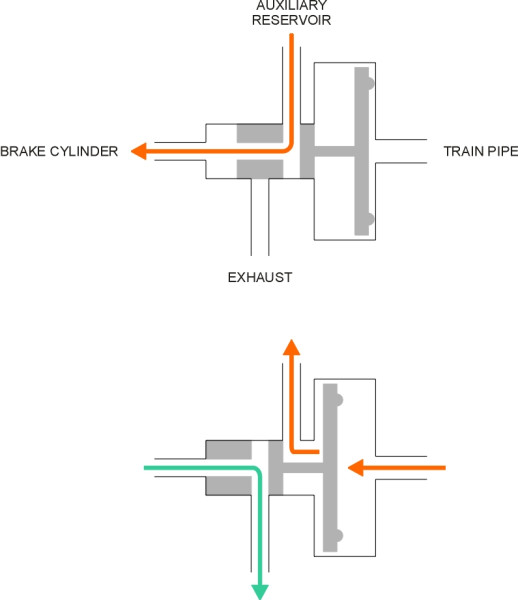
What was needed was an ‘automatic’ system that used a fall in the train pipe pressure as a signal to release compressed air from reservoirs installed locally at points along the train. This was the rationale underlying the Westinghouse automatic air brake introduced 1872-3, which acted more quickly and was inherently fail-safe. It remains the basis of air brakes used throughout the railway industry today, as well as heavy road vehicles such as buses and trucks (figure 14). It is the auxiliary reservoir on board each vehicle - not the train pipe - that supplies the braking force: the train pipe provides the signal, which is a reduction in pressure. Air compressors on passenger rolling stock are mounted every 2 - 4 cars [8]. The key is the control valve, often known as the ‘triple valve’, that controls the operation of each brake cylinder. A cross-section of a control valve looks complicated; you can find an example in [7], this being the Japanese ‘K’ valve used on some of the Shinkansen trains. But the principle is fairly straightforward and in text books it is usually shown in simplified form. There are several different ways to represent what happens (see for example [21]). Our version appears in figure 15. When the driver moves the brake handle, the movement allows air to be released into the atmosphere from the train pipe. The pressure drop in turn causes each control valve to admit air from its own reservoir to flow into the brake cylinder, which activates the brake. In practice, a modern control valve contains a distributor valve that (a) allows the driver to apply gradual changes in braking force and (b) conserves air supplies.
What happens when the driver releases the brake handle is just as important. The pressure in the brake pipe is reinstated from the main reservoir, and this returns each control valve to its neutral position, which re-connects each local reservoir to the train pipe for re-charging. Simultaneously the air in the brake cylinder is released into the atmosphere, and it’s this release that creates the characteristic hissing noise that you hear for example when a lorry stops in the High Street. But re-charging the local reservoirs takes time, and frequent application and release of the brakes temporarily reduces the effectiveness of the system.
Many modern systems are twin-pipe systems that allow the brakes on a long train to be released more quickly. The first pipe communicates the signal as before. The second is connected directly to the auxiliary reservoir on each braked vehicle and provides a fast re-charge independently of the status of the ‘control’ pipe. In day-to-day operations the two circuits must be kept separate and the couplings are therefore painted in different colours. Japanese engineers have developed a ‘straight’ air brake system with two train pipes and no auxiliary reservoirs or triple valves [9]. Another refinement is the electro-pneumatic braking system, developed in the 1960s to overcome the problem of transmission delay. The electro-pneumatic system can be viewed as an enhancement to the conventional automatic system that speeds up the braking signal and also the release signal. There are two sets of electrically controlled valves, with one of each type installed for every brake cylinder along the train. Valves of the first type are built into the main brake pipe. Each one speeds evacuation and hence the discharge from the auxiliary reservoir into the brake cylinder to which it is attached. A valve of the second type speeds subsequent release by enabling recharging of the reservoir from the auxiliary pipe. More recent versions incorporate a fail-safe protocol into the electrical system that avoids the need for a primary train pipe [3].
Wheel slide protection
Most cars are fitted with anti-lock brakes. As explained in Section C0816, they prevent the wheels from locking if the driver presses too hard on the brake pedal. Wheel slide protection is also provided on railway vehicles, where efficient braking is equally important. Not only do locked wheels increase the stopping distance, but they also result in damage to the wheel treads in the form of ‘flat spots’ that must be ground off later in the maintenance depot.
However, different forms of wheel slide protection are used for different types of vehicle. In the case of passenger trains, the system works in much the same way as the anti-lock braking system used on road vehicles, with one important difference that we’ll come to in a moment. The system works on an iterative cycle, during which (a) information is fed into the control unit, (b) the control unit decides what intervention is necessary, (c) the intensity of braking is adjusted, and (d) the state of the vehicle changes accordingly. Afterwards, new information is fed into the control unit and the cycle is repeated. The input consists of two variables: the speed of the vehicle and the speed of rotation of the wheel. The speed of the vehicle is usually extrapolated from earlier measurements or deduced from other axles of the vehicle that have not yet been flagged as undergoing slide. The speed of the wheel is measured directly by an electronic transducer. The control unit then compares the vehicle speed with the peripheral speed of the wheel, and if the difference exceeds a particular threshold it overrides the brake cylinder valve, reducing the braking effort until the speed difference falls below the threshold. The difference between the railway system and the system used on a road vehicle is that the railway system works much more slowly, and while a road vehicle system is a simple ‘on-off’ protocol operating at more than 10 cycles per second, a railway system produces graduated changes in the intensity of braking over a cycle time of several seconds.
All this depends on having a power supply on board for each braked axle, which is rarely the case for freight wagons. One solution is to install load-proportioning valves of the kind often used on road-going trucks, which adjust the braking force according to whether the vehicle wagon is loaded or not. However, in recent years, at least one manufacturer [13] has introduced a wheel slide protection device powered from a generator fixed separately to each wheel set. It can be retro-fitted to an existing fleet.
Conclusion
Railway engineers have found the task of developing an effective braking system both complicated and challenging. For many years, one problem in particular has exercised their ingenuity and continues to do so today. A freight train may consist of 50 wagons and extend over a distance of half a kilometre or more. From time to time, the driver will need to stop the train or slow it down on a steep gradient, for example. The movement of the brake lever can be thought of as a signal or command that must be communicated to all the vehicles in the train. Few freight wagons have electrical power, so the signal must be carried from one wagon to the next through purely mechanical means. The system must work reliably despite a harsh operating environment in which wagons are exposed to the weather and jostle one another as they roll along a bumpy track. The challenge is to ensure that the signal is propagated faithfully through (say) 50 sets of couplings so that the brakes on the last wagon are applied almost immediately and at a level of intensity that echoes the pressure of the driver’s hand on the brake lever. In practice the signal takes an appreciable time to arrive so the wagons at the rear don’t slow down straight away and some run into the buffers of the wagon in front. The result is a series of jolts that can cause significant damage, and therefore a great deal of skill is needed from the driver to handle a freight train in hilly country. We’ll be looking at some of these issues again in Section R0118.
Appendix 1: Kinetic and potential energy
A moving vehicle is said to have kinetic energy. Even though we can’t see it or touch it, we know that kinetic energy exists because a vehicle won’t move unless it is supplied with energy from an external source such as petroleum fuel. Some is wasted in friction and heat, but a major part of the fuel energy is transformed into the kinetic energy of motion. And since energy can neither be created nor destroyed, the vehicle will continue to move until its kinetic energy is taken away, when it reappears usually in the form of heat dissipated from the brakes, or through aerodynamic drag that stirs the atmosphere into motion instead. But the kinetic energy associated with motion is not the only kind of energy a vehicle might possess. If you lift it vertically into the air through a distance \(h\), it acquires potential energy. By definition, the work done on the vehicle is equal to the force \(m\) needed to raise it times the distance moved, in other words:
(4)
\[\begin{equation} \textrm{Potential energy} \quad = \quad mgh \end{equation}\]This energy is now embodied within the vehicle, and it is called ‘potential’ because it is not yet manifested in motion. But if you let the vehicle fall it will accelerate, and as it does so, the potential energy is transformed progressively into kinetic energy, the transformation being complete when the vehicle reaches the ground. Assuming the air resistance during the descent is small enough to be ignored, the kinetic energy at this point will be equal to the potential energy at height \(h\), so
(5)
\[\begin{equation} \textrm{Kinetic energy at ground level} \quad = \quad mgh \end{equation}\]We can use this thought-experiment to confirm that a vehicle’s kinetic energy is equal to \(\frac{1}{2} mv^{2}\) where \(m\) is the vehicle mass and \(v\) its speed. The speed with which it hits the ground can be obtained from the well-known constant acceleration formula
(6)
\[\begin{equation} v^2 \quad = \quad u^2 \; + \; 2ax \end{equation}\]where \(v\) represents the final speed, \(u\) the initial speed, \(a\) the acceleration, and \(x\) the distance travelled. In this case we put \(u = 0\), \(a = g\) (the acceleration due to gravity), and \(x = h\). After dividing both sides by two and re-arranging we get
(7)
\[\begin{equation} gh \quad = \quad \frac{v^2}{2} \end{equation}\]and then substituting for \(gh\) on the right-hand side of equation 5 yields the result
(8)
\[\begin{equation} \textrm{Kinetic energy} \quad = \quad \frac{1}{2}mv^2 \end{equation}\]In an ideal world where friction and air resistance are small enough to be ignored, we can observe in the motion of any vehicle such as a railway train a continual exchange between kinetic and potential energy as it climbs and descends gradients during the course of a journey. This can sometimes be exploited for practical gain, in the design of an underground railway to minimise fuel consumption (see Section R1604). More generally, the idea that either form of energy can be converted into the other helps one to understand the behaviour of moving vehicles. Suppose a train of mass \(m\) is moving along a level track at a speed \(v\) equal to 350 km/h. Its kinetic energy is \(\frac{1}{2} mv^{2}\), but what does this amount to in practical terms? Let’s imagine the kinetic energy converted into an equivalent amount of potential energy, by lifting the train vertically to a height \(h\) above the track. How high would the train have to be raised so its potential energy were equal to its kinetic energy when travelling at 350 km/h? We simply equate the two energies:
(9)
\[\begin{equation} mgh \quad = \quad \frac{1}{2} mv^2 \end{equation}\]to get
(10)
\[\begin{equation} h \quad = \quad \frac{v^2}{2g} \end{equation}\]and substituting 9.81 m/s2 for \(g\) and \(350 \times 1000 / 3600\) m/s for \(v\) we get
(11)
\[\begin{equation} h \quad = \quad 482 \rm{ m} \end{equation}\]Hence the kinetic energy at 350 km/h is equivalent to the energy needed to lift the train to a height of nearly half a kilometre - and by implication, the energy that would be dissipated if the train were allowed to fall until it hit the ground.
Appendix 2: Two braking strategies
If a vehicle accelerates at a constant rate \(a\) from an initial speed \(u\) to a final speed \(v\) over a distance \(x\), then the four quantities \(a\), \(u\), \(v\) and \(x\) are related by the well-known formula
(12)
\[\begin{equation} v^2 \quad = \quad u^2 \; + \; 2ax \end{equation}\]and if we want to find the distance \(s\) required to come to a halt we can put \(x = s\) and \(v = 0\) in the equation and re-arrange it to get the following expression (note that since the train is slowing down the value of \(a\) will be negative and \(s\) will come out positive):
(13)
\[\begin{equation} s \quad = \quad - \frac{u^2}{2a} \end{equation}\]Hence if we regard the acceleration as determined in advance by the friction between the wheel and the rail, the braking distance is proportional to the square of the speed. However in what follows we shall treat the braking distance as determined in advance and work out two alternative braking strategies for achieving it. In the first model the rate of acceleration is held constant throughout at a value \(a = a_{c}\), and our first task is to find \(a_{c}\) in terms of \(s\), which we get by substituting \(a_{c}\) for \(a\) and re-arranging equation 13 in the form
(14)
\[\begin{equation} a_c \quad = \quad - \; \frac{u^2}{2s} \end{equation}\]What about the time required for the braking process? We’ll call this time \(t_{c}\) and use another well-known formula:
(15)
\[\begin{equation} v \quad = \quad u \; + \; at \end{equation}\]and after putting \(t = t_{c}\), \(v = 0\) and \(a = a_c\) and substituting the expression on the right-hand side of equation 14 for \(a_{c}\) and re-arranging, we get
(16)
\[\begin{equation} t_{c} \quad = \quad - \frac{u}{a_c}\quad = \quad \frac{2s}{u} \end{equation}\]Next we’ll find an expression for the distance travelled at each moment during the braking process as a function of time, using another well-known formula:
(17)
\[\begin{equation} x \quad = \quad ut \; + \; \frac{1}{2} a t^{2} \end{equation}\]from which after substituting for \(a_{c}\) as before we get
(18)
\[\begin{equation} x \quad = \quad ut\; - \; \frac{u^{2} t^{2}}{4s} \end{equation}\]At this point we shall anticipate the benefits of working with dimensionless variables, by expressing the distance travelled as a proportion of the total braking distance \(s\), and similarly time as a proportion of the braking time \(t_{c}\). To pull off this trick, we first re-write equation 18 as
(19)
\[\begin{equation} \frac {x}{s} \quad = \quad u\left( \frac{t}{t_c} \right).\frac{t_c}{s} \; - \;u^{2} \left( \frac{t}{t_c} \right)^{2} . \frac{t_{c}^{2}}{4 s^2} \end{equation}\]In this equation, we want to turn \(x/s\) into the dimensionless ‘distance’ variable \(X\), and \(t/t_c\) into the dimensionless ‘time’ variable \(T\). Note that by definition, \(0 \leq X \leq 1\) and likewise \(0 \leq T \leq 1\) and we’ll take this as read throughout. We shall also substitute for the remaining occurrences of the term \(t_{c}\) via equation 16, and after re-arranging we get the much nicer expression
(20)
\[\begin{equation} X \quad = \quad 2T \; - \; T^2 \end{equation}\]We can also treat this as a quadratic equation that can be solved for \(T\), from which we get:
(21)
\[\begin{equation} T \quad = \quad 1 \; - \; \sqrt {1 - X} \end{equation}\]Now we can look at the way the speed changes continuously throughout the braking process. The first point to notice is that since the acceleration is constant, the speed must fall at a steady rate from \(u\) to zero, so we can say straight away that
(22)
\[\begin{equation} v \quad = \quad u \left( 1 - \frac{t}{t_c} \right) \end{equation}\]and if we write \(v/u\) as the dimensionless variable \(V\) and \(t/t_{c}\) as \(T\) this becomes
(23)
\[\begin{equation} V \quad = \quad 1 - T \end{equation}\]But how does the speed vary with distance? The expression we need comes directly from equation 12 after substituting \(a_c\) for \(a\) and then substituting the expression on the right-hand side of equation 14 for \(a_{c}\) thus:
(24)
\[\begin{equation} v^2 \quad = \quad u^2 \; + \; 2\left( - \frac{u^2}{2s} \right) x \end{equation}\]or after re-arranging
(25)
\[\begin{equation} \left( \frac{v}{u} \right)^{2} \quad = \quad 1 \; - \; \left( \frac{x}{s} \right) \end{equation}\]in which we can write \(v/u\) as the dimensionless variable \(V\) and \(x/s\) as \(X\) so that
(26)
\[\begin{equation} V^{2} \quad = \quad 1 - X \end{equation}\]or
(27)
\[\begin{equation} V \quad = \quad \sqrt {1 - X} \end{equation}\]We’ll plot these curves later, but meanwhile you might care to observe that equation 26 has an interesting consequence. It tells us the square of the speed declines linearly with distance during the braking process, and in fact any quantity that is proportional to the square of the speed must also fall in the same way. Now the kinetic energy of the train at any point is equal to half its mass times the square of its speed, so the kinetic energy is one such quantity. We therefore deduce that with constant (negative) acceleration, a train will shed equal increments of energy for equal increments of distance travelled. This can be important in circumstances where the heat could disturb the environment, for instance in the close confines of a tunnel. In braking at a constant rate, the train will distribute its energy equally along the tunnel cavity until it halts, which is the best you could hope for in the sense that anything else would imply an unwelcome concentration of heat somewhere. However, there is a possible disadvantage: the rate of dissipation is not uniform over time, and in fact it starts at a high level and declines linearly over time to zero at the moment when the train stops. So from the point of the vehicle, heat has to be removed from the brakes rather quickly at the beginning of the sequence, and less so as the sequence proceeds. If sufficient ventilation can’t be provided to disperse the initial load, the brakes may overheat.
An alternative is to design a braking regime in which the rate of acceleration is not constant, but controlled in such a way that energy is dissipated at a constant rate over time. Let the time taken to stop in this case be \(t_{e}\). Then since the kinetic energy at the start is \(\frac{1}{2} mu^{2}\) and at the finish it is zero, the kinetic energy \(\frac{1}{2} mv^{2}\) at any intermediate time must satisfy
(28)
\[\begin{equation} \frac{1}{2}mv^{2} \quad = \quad \frac{1}{2} mu^{2} \left( 1 - \frac{t}{t_e} \right) \end{equation}\]so that
(29)
\[\begin{equation} v \quad = \quad u \sqrt {1 - \left( \frac{t}{t_e} \right)} \end{equation}\]and the distance travelled at time \(t\) will be given by
(30)
\[\begin{equation} x \quad = \quad \int \limits_0^t {v d\tau } \quad = \quad \int \limits_0^t {u \left( 1 - \frac{\tau }{t_e} \right)}^{\frac{1}{2}} d\tau \quad = \quad \frac{2}{3} u t_{e} \left[ 1 \; - \; \left( 1 - \frac{t}{t_e} \right)^{\frac{3}{2}} \right] \end{equation}\]But at the end of the braking sequence \(t = t_{e}\) and \(x = s\). Substituting these values into equation 30 we get
(31)
\[\begin{equation} s \quad = \quad \frac{2}{3} u t_{e} \end{equation}\]so that
(32)
\[\begin{equation} t_{e} \quad = \quad \frac{3s}{2u} \end{equation}\]If we compare this with equation 16 we see that for the constant dissipation case, although the braking distance has the same (predetermined) value, the train halts within a shorter time, and that in fact
(33)
\[\begin{equation} t_{e} \quad = \quad \frac{3}{4} t_c \end{equation}\]Now we can return to equation 30 and re-cast it in a simpler dimensionless form that can be compared directly with the corresponding curve for the constant acceleration model, provided we stick to the same dimensionless time variable \(T\), which we have already defined as equal to \(t/t_{c}\). From the above it is apparent that
(34)
\[\begin{equation} \frac{t}{t_e} \quad = \quad \frac{4}{3}.\frac{t}{t_c} \quad = \quad \frac{4}{3} T \end{equation}\]and if we substitute the right-hand side for \(t/t_{e}\) in equation 30 we get
(35)
\[\begin{equation} x \quad = \quad \frac{2}{3} ut_{e} \left[ 1 \; - \; \left( 1 - \frac{4}{3} T \right)^\frac{3}{2} \right] \quad \quad \quad \left( T \le \frac{3}{4} \right) \end{equation}\]Next, we substitute the right-hand side of equation 32 for \(t_{e}\) and divide both sides by \(s\), replacing \(x/s\) with \(X\), to find that
(36)
\[\begin{equation} X \quad = \quad 1 \; - \; \left( 1 - \frac{4}{3} T \right)^{\frac{3}{2}} \quad \quad \quad \left( T \le \frac{3}{4} \right) \end{equation}\]Algebraically, this expression looks nothing like the corresponding one for constant acceleration in equation 20. The shapes of the two curves are compared in figure 7, from which it is clear that in the constant dissipation case, the train comes to a halt sooner.
Now let’s look at the speed profiles. We have already determined an expression for the way speed falls with distance for the constant acceleration case in equation 27. To get the constant dissipation case, we start with equation 29 and re-write it in the slightly modified form
(37)
\[\begin{equation} \frac {v}{u} \quad = \quad \sqrt {1 - \left( \frac{t}{t_e} \right)} \end{equation}\]and writing \(v/u = V\) and substituting for \(t/t_{e}\) using equation 34 we get
(38)
\[\begin{equation} V \quad = \quad \sqrt {1 - \frac{4}{3} T} \quad \quad \quad \left( T \le \frac{3}{4} \right) \end{equation}\]But from equation 36 we see that
(39)
\[\begin{equation} 1 - \frac{4}{3} T \quad = \quad \left( 1 \; - \; X \right)^{\frac{2}{3}} \end{equation}\]so that after substituting in equation 38
(40)
\[\begin{equation} V \quad = \quad \left( 1 - X \right)^{\frac{1}{3}} \end{equation}\]This compares with the speed profile for constant acceleration specified in equation 27. The two are plotted together in figure 8, which shows how in the constant dissipation case the train is going faster at each point along the track before it comes to abrupt halt. Just how abrupt is the halt becomes clearer if we compare the acceleration profiles. In the first model of course, the acceleration is constant. To get the profile for the second model we differentiate both sides of equation 29 thus:
(41)
\[\begin{equation} a \quad = \quad \frac{dv}{dt} \quad = \quad \frac{1}{2} u \left( - \frac{1}{t_e} \right) \left[ 1 - \left( \frac{t}{t_e} \right) \right]^{ - \frac{1}{2}} \end{equation}\]and after substituting for \(t/t_{e}\) in the square bracket using equation 34 and substituting \(3s / 2u\) for the remaining \(t_{e}\) we get
(42)
\[\begin{equation} a \quad = \quad \frac{1}{2} u\left( - \frac{2u}{3s} \right) \left( 1 - \frac{4}{3}T \right)^{ - \frac{1}{2}} \end{equation}\]Now in the constant acceleration case we have \(a_{c} = - u^{2} / 2 s\) and we can therefore substitute \(2a_{c}\) for the quantity \(-u^{2}/s\) on the right hand side. This gives after some re-arrangement
(43)
\[\begin{equation} \frac{a}{a_c} \quad = \quad \frac{2}{3} \left( 1 - \frac{4}{3}T \right)^ {- \frac{1}{2}} \end{equation}\]Now we can write the left-hand side as a dimensionless ‘acceleration’ \(A\), and substituting for the expression in braces via equation 39 leads finally to
(44)
\[\begin{equation} A \quad = \quad \frac{2}{3} \left( 1 - X \right)^{ - \frac{1}{3}} \end{equation}\]For the constant acceleration case the value of the equivalent dimensionless variable is just \(a_{c}\) divided by \(a_{c}\) which is unity throughout the braking sequence. The two curves are plotted for comparison in figure 9, where we see that in the constant dissipation case the dimensionless acceleration increases rapidly towards the end of the braking sequence and in fact approaches infinity as \(x \rightarrow s\). At some point it is certain that the friction demanded between the wheels and the rail is greater than the available friction and the wheels will lock. Hence the constant dissipation model is not feasible as it stands.