
© A towering cumulonimbus cloud
A.1918
The aerial environment
‘Understanding weather phenomena in the middle latitudes is a major task… the complexity of the problem is enormous…’
Engineers have been building flying machines for more than a century. An aircraft is unlike any other vehicle in the sense that its weight draws it perpetually downwards, and it can only stay aloft by reacting against the surrounding atmosphere. In the same way that ships propel water astern to drive them forward, aircraft manipulate the air around them to provide ‘lift’. We rarely notice the air around us, but it’s made up of gases that support small quantities of liquid and solid matter, together with a surprising number of living creatures of different shapes and sizes. And the air parcels themselves are moving, mostly in a horizontal direction and sometimes up and down as well. In this Section we’ll briefly describe the contents of the atmosphere, the physical processes that take place within it, and the forces that drive them.
The earth’s atmosphere
If we look at the atmosphere as a whole, we can distinguish a number of layers stacked on top of one another. They are relatively thin, but each has its own particular characteristics, and together they form a protective shell around our planet.
Structure and composition
Our atmosphere forms a relatively thin skin around the surface of the earth, but it contains four distinct layers as shown in figure 1.
Figure 1
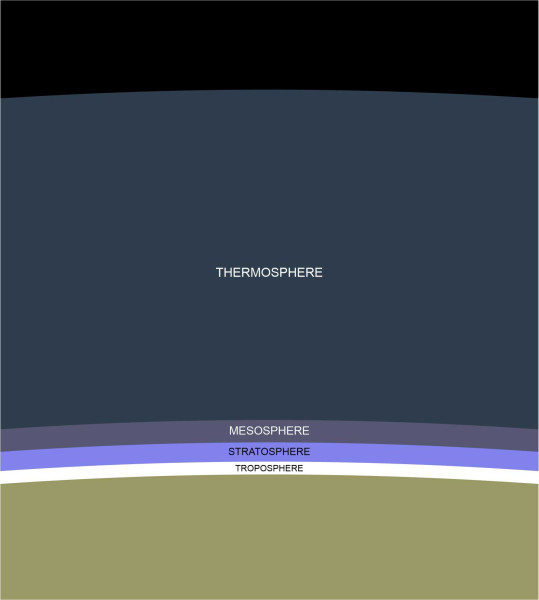
They are known as the troposphere, the stratosphere, the mesosphere, and the thermosphere. The bottom layer, the troposphere, contains more than three-quarters of the total atmospheric mass. It is the layer where creatures live and where most aircraft fly. Commercial jets cruise near the top of the layer where the air is relatively thin, while small planes fly lower down. The height of the layer isn’t uniform: it’s about 18-20 km high at the equator and lower at the poles [19], and it is continually in motion as weather systems develop and disperse around the planet. As a general rule, the wind speed increases with increasing height, and the temperature falls too.
The next layer is the stratosphere. It extends upwards to a height of 50 km and contains a sheet of ozone, which absorbs and scatters the ultraviolet radiation from the sun (NASA), which is why, on a clear day, the sky appears blue. The radiation has a warming effect, so the temperature increases with height, which makes this layer more stable, with relatively calm flying conditions. But since the air is relatively thin, only high-speed aircraft fly this high, most of them military.
Beyond the stratosphere is the mesosphere. Here, the temperature falls again, but the air is too thin to behave like a continuous gas, because the molecules are spaced too far apart and move around independently like specks of dust. Nevertheless, they will heat up a space capsule returning to earth at the end of its mission, and burn up meteors that happen to arrive on a collision course with the earth. Beyond is the thermosphere, which stretches from the top of the mesosphere at a height of 85 km upward to around 600 km. With few molecules to resist vehicle motion, it’s the natural height for orbiting satellites.
Each of these four layers consists mainly of two gases: nitrogen and oxygen in the ratio of about four to one by volume. The molecules (denoted by the symbol \(N_{2}\) for a nitrogen molecule and \(O_{2}\) for oxygen) dart about and frequently collide with one another. There’s also a significant amount of water in the atmosphere. Some exists in the form of ice crystals, some as water droplets, and some as an invisible vapour. The ability of the air to accommodate water vapour is measured in terms of the saturation vapour pressure, a term with which you may already be familiar. It represents the maximum possible contribution to the total pressure that the water vapour can make when contained within a gas, assuming the gas is in long-term contact with a liquid water surface. Within the atmosphere, it varies from place to place around the globe, and because it rise exponentially with increasing temperature, it is higher at the equator than at the poles, and falls with increasing altitude almost to zero at 10 km above mean sea level. If you’re interested, you can find a comprehensive account in [21]. Details of other chemical constituents of the atmosphere are given in [1].
How conditions vary with height
The conditions for aircraft when cruising at altitude are very different from those on the ground. We can see this in terms of the key variables: the temperature, pressure, and density of the air, and how they change with height. The average wind speed varies too, but we’ll deal with it separately later. Under normal conditions in the troposphere, the air temperature falls by around 6.4\({^\circ}\)C for every 1000 m increase in height, a figure known as the ‘lapse rate’ [1]. It is represented by the dark line in figure 2, which shows that by the time you reach the tropopause at 11 000 m, the temperature has fallen to around -57\({^\circ}\)C. Since most of the heat in our atmosphere comes from the sun, it’s not obvious why the temperature should be lower at high altitude, closer to the heat source.
Figure 2
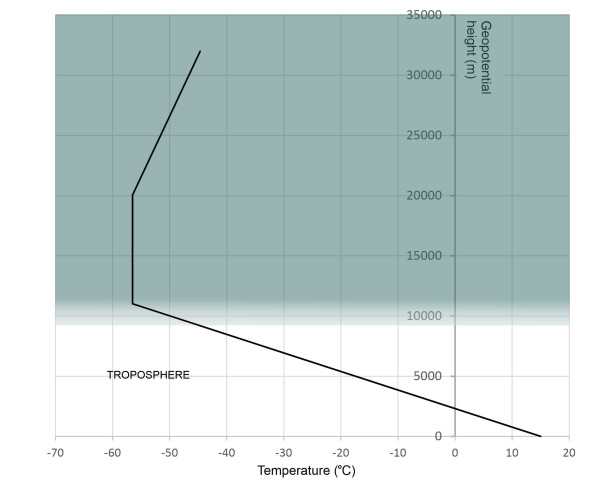
The reason is that most of the sun’s radiation passes straight through the atmosphere, to be absorbed by the oceans and land masses that make up planetary surface. It raises their temperature so that particles of sea water evaporate, carrying some of the heat energy with them. It is now in the form of latent heat stored in water vapour, which rises and releases the energy again when it condenses into water droplets. So in effect, the sun’s energy is delivered to the troposphere from below. Hence, the troposphere is fundamentally unstable, with rising currents in some areas and falling currents in others, movements that bring about varying weather conditions and varying lapse rates as the temperature and pressure vary from place to place across the earth’s surface. But further up, conditions in the stratosphere are different: the temperature rises with increasing height because of the ultra-violet radiation scattered by the ozone layer mentioned earlier. Here, the atmosphere is relatively stable. Figure 2 shows how the temperature varies with height as specified within the US Standard Atmosphere up to the stratopause, using the equations set out in [14].
The pressure of the atmosphere that we observe at ground level arises from the weight of the air, pulled down by gravity towards the earth’s surface. As you can imagine, it falls with increasing altitude, where there is less material pressing down from above. Although it’s a more complicated problem than it looks, the decline in pressure with height can be quantified, and there are formulae for predicting air pressure as a function of altitude, with different equations applying to different atmospheric layers. Here, we shall use the best-known model, which dates from 1976. Known as the US ‘Standard atmosphere’, it is described in detail in a 243-page US government publication [13]; the key formulae are conveniently available in metric units in [14]. The results are plotted in figure 3.
Figure 3
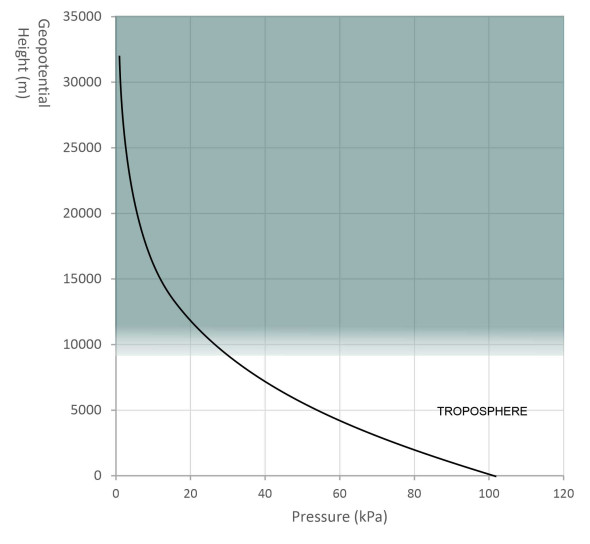
Engineers measure fluid pressure in pascals (Pa). One pascal is equivalent to one newton per square metre, but for meteorologists, the standard unit of atmospheric pressure is the millibar, equal to 100 Pa, and they quote the mean atmospheric pressure as 1013.25 mbar. Because the atmospheric pressure varies with height above sea level, if you happen to live on a mountain in the Pyrenees, for example, the average will be somewhat less than in Rome. For the same reason, the local pressure at an airport depends on its location, and if you’re a pilot preparing to take off or land there, you’ll want to know its value, a quantity known as the ‘station pressure’. To see why this is important, we’ll need to examine the behaviour of an ideal gas.
The density \(\rho\) of an ideal gas is related to its temperature and pressure via a formula known as the ‘equation of state’. Here we’ll use the form that applies to a fixed quantity of gas, namely a unit mass:
(1)
\[\begin{equation} pv\; =\; RT \end{equation}\]where \(p\) is the pressure, \(v\) the volume per unit mass, \(R\) is the ‘gas constant’ (which takes on a different value for different gases or different gas mixtures), and \(T\) is the absolute temperature in Kelvins. Since by definition the density equals \(1/v\), it follows from equation 1 that
(2)
\[\begin{equation} \rho \; =\; {p/RT} \end{equation}\]Hence, if we know the temperature and the pressure, we can easily work out the density of the air at any particular altitude. Figure 4 shows how it varies within the troposphere and the lower part of the stratosphere.
Figure 4
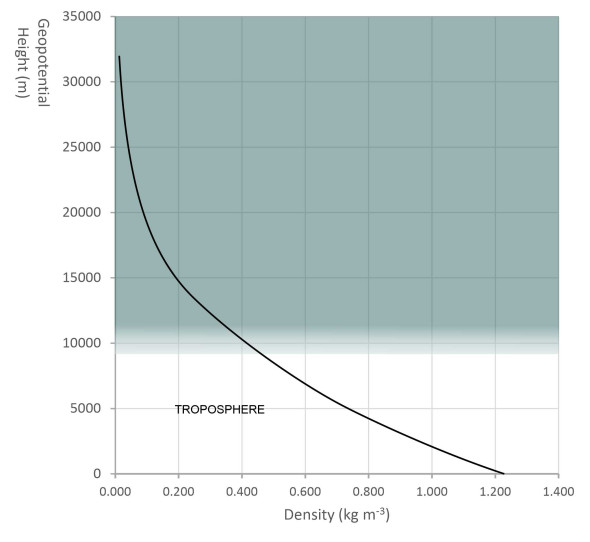
The density \(\rho\) of the atmosphere is an important factor in aircraft flight, because the forces acting on a body moving through a fluid are proportional to \(\rho\), as can be seen from the classical formulae for the drag or resistance \(D\) and the lift \(L\), as previously set out in equation 9 and equation 10 in Section F1817:
(3)
\[\begin{equation} D\; =\; \tfrac{1}{2} \rho V^{2} AC_{D} \end{equation}\](4)
\[\begin{equation} L\; =\; \tfrac{1}{2} \rho V^{2} AC_{L} \end{equation}\]where \(V\) is the velocity, \(C_{D}\) is the ‘drag coefficient’, \(C_{L}\) is the ‘lift coefficient’, and if we’re thinking about the lift and drag associated with an aircraft wing, \(A\) is the plan area of the wing. You’ll have noticed that around the tropopause, the density of the atmosphere is only about a third of its value at sea level, so if you’re flying at an altitude of 11 000 m, at any given speed the drag will be reduced to one third of the value at ground level. But the wings will be producing only a third of the lift, so to stay aloft, the aircraft will need to fly a lot faster.
A hundred years ago, aircraft flew only a few hundred metres above the ground. What happened at higher altitudes didn’t concern them, because at higher altitudes, the air thinned out, the wings produced less lift, and petrol engines struggled to draw in enough oxygen. Today, it’s the other way round. A turbojet engine is designed to generate power when travelling at high speed through thin air, so it can create enough lift to support the aircraft’s weight while flying much higher and faster than it can close to the ground. Nevertheless, all aircraft must land at a relatively slow speed, so the ‘station pressure’ of the airport at the beginning and end of the flight is important. A plane taking off from a runway located high in a mountainous region will need a longer runway than it would when taking off from an airport close to sea level.
The atmosphere in motion
The air around us is moving all the time, in ways that we can observe on different scales of measurement from the very small to the vary large. On the largest scale, the atmosphere circulates in a more-or-less regular pattern around the globe. The motion is driven by the temperature difference between the tropics and the poles. There is a steady heating effect around the equator and a steady cooling effect at higher latitudes, and to maintain equilibrium, heat must flow between the two. It is carried along by parcels of air, so that in effect the atmosphere is a giant circulation system that moves energy from the equator to the poles. The pattern of movement is the same in both hemispheres, so we’ll concentrate on what happens north of the equator.
You might expect the heat rising from the equator to continue at high altitude until it reaches the north pole, but in fact it doesn’t get that far. The heat transfer takes place in three stages that are connected like links in a chain. The reason is that the atmosphere is like a sheet wrapped around the globe, whose thickness is small compared with distance between the equator and the north pole. The upper layer of warm air and the lower layer of cool air rub across one another so that the system breaks down into separate ‘cells’.
Figure 5
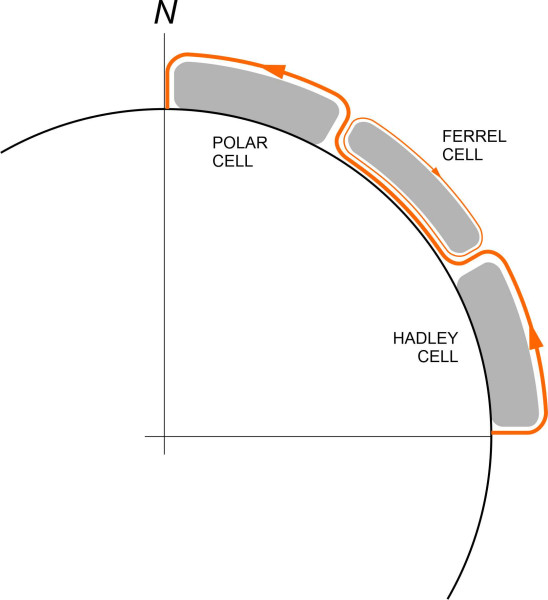
figure 5 is a cross-section showing the chain of cells in diagrammatic form. The height is exaggerated so we can see what is going on, and in reality, the movement is not actually northwards, because the earth is spinning on its axis and each air parcel is deflected by the Coriolis effect so it swings to the east.
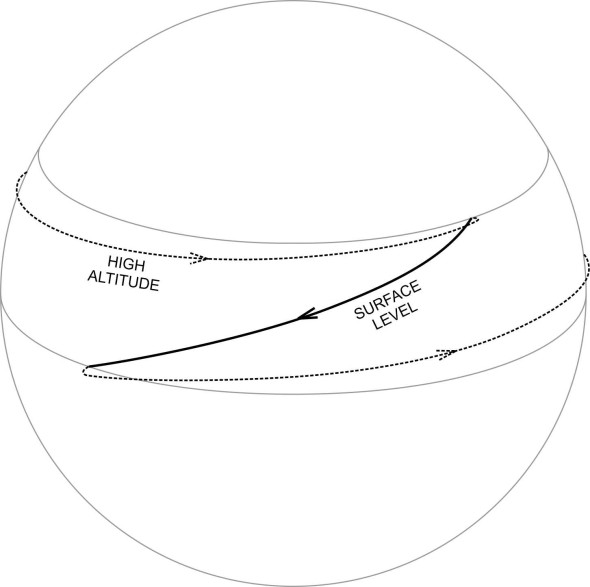
In the first stage, the rising current turns north and after about 30 days, it releases its heat and sinks back to the earth’s surface at a latitude of around 30\({^\circ}\), where it turns south towards the equator to begin the cycle again. Together, such parcels constitute a distinct circulation pattern known as a Hadley cell. As shown diagrammatically in figure 6, the low-altitude leg veers to the east so each parcel spirals right round the planet before descending again, while the low-altitude leg veers to the west.
Figure 6
At the next stage of the chain, we move on to another circulating pattern: the Ferrel cell. In the northern hemisphere it occupies a region that stretches from a latitude of about 30\({^\circ}\) to a latitude of about 60\({^\circ}\). It, too, transmits energy northwards, but in a different way. Rotating in the opposite direction, it carries heat along the earth’s surface (figure 7).
Figure 7
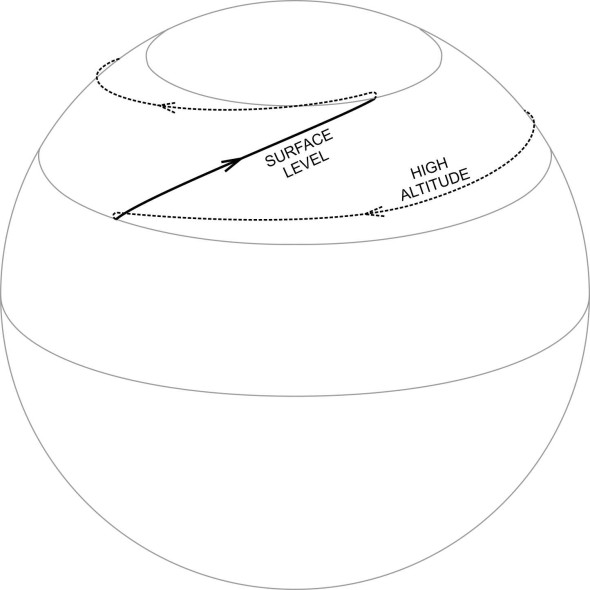
The heat exchange at the northern boundary relies on turbulence on a large physical scale in which meandering currents or eddies of warm air mix with the cooler air to the north. The meandering currents take on a distinctive shape: ‘fingers’ of warm air that project northwards from the Ferrel cell, alternating with ‘fingers’ of cold air projecting southwards from the polar cell (Vanyo 01 p342). The Polar cell is the last stage in the heat chain. Here, the circulation takes place in the same direction as in the Hadley cell, carrying heat energy at high altitude towards the pole, where the air cools and descends. It then turns southwards to begin the cycle again.
The boundary layer
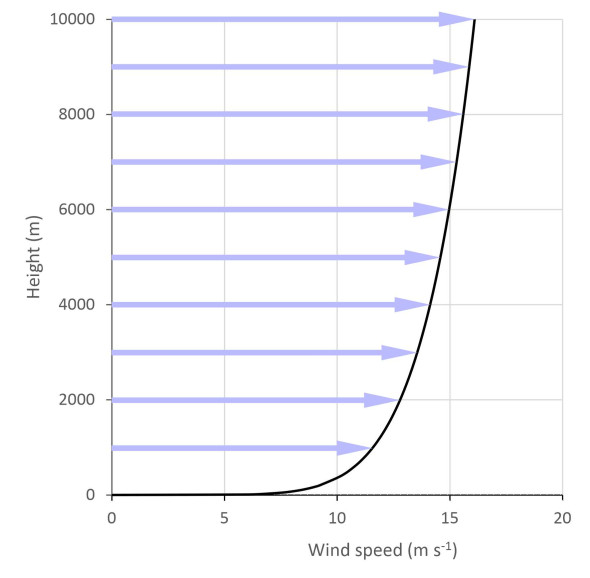
At the bottom of the atmosphere, within a region known as the boundary layer, the wind slows down because of friction with the earth’s surface. The boundary layer thickness [15] varies from place to place over a range of a few metres to an altitude of 2 kilometres. Starting at the surface, the wind speed is zero and the average rises with altitude. We can plot its value using the 1/7th power law widely applied to turbulent boundary layers in aerodynamic engineering, and adapted by the UK National Renewable Energy Centre [7] for wind turbines:
(5)
\[\begin{equation} v(z)=v_{10} \left(\frac{z}{10} \right)^{\mathrm{\alpha }} \end{equation}\]where \(v\left(z\right)\) is the mean speed at height \(z\), with \(v\) in metres per second and \(z\) in metres, \(v_{10}\) is the speed at a reference height of 10 m, and \(\alpha\) is a power index whose value is around 1/7. The curve is plotted in figure 8. Note that the direction varies with increasing altitude, swinging (in the northern hemisphere) gradually clockwise, under the influence of the Coriolis effect.
Figure 8
Weather systems
At a more local level, we find that the behaviour of the atmosphere tends to be fragmented and chaotic. It involves processes that are hard to predict, partly because they can’t be described in terms of a simple mathematical model.
Thermals
Within the boundary layer, vertical air currents often occur in warm weather. In areas of open ground, the sun heats the earth’s surface, and as it warms up, it transfers some of the heat to the air immediately above. Since the nature of the ground surface varies from place to place, the heating is uneven, and in some places, the air heats up more quickly and expands as it does so relative to the air in the surrounding region. Being less dense, the warm air will tend to rise. Generally speaking, the temperature of the atmosphere falls with increasing height, and as long as a heated air parcel remains warmer than its surroundings, it doesn’t stop. And as it continues to rise, it draws in more warm air from the ground below to form a vertical column that grows naturally to a diameter of around 20 metres. A self-sustaining column of this kind is often called a thermal (figure 9).
Figure 9
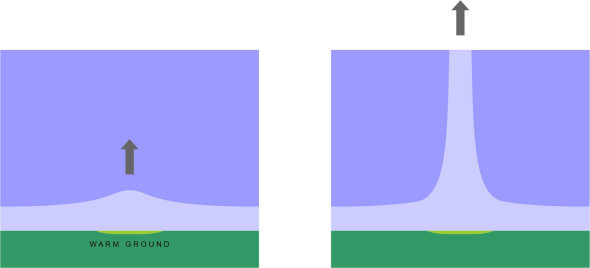
You can see its position in the landscape, because it usually contains water vapour. As vapour, it’s invisible, but the air cools down as it expands, and the vapour condenses into droplets or even ice particles that create a small cumulus cloud at the top of the column (figure 10).
Figure 10
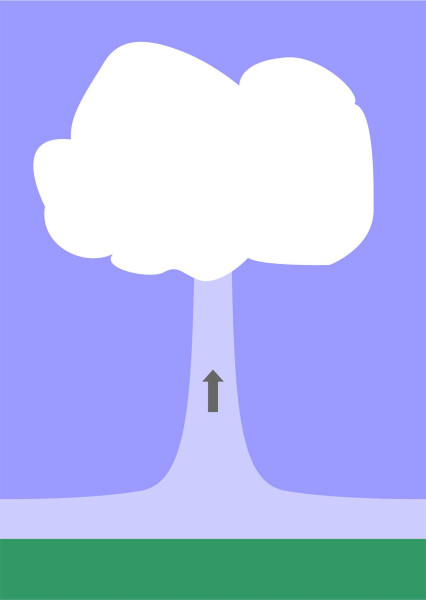
This releases latent heat, which slows down the cooling, increases the buoyancy of the rising air parcel relative to the surrounding atmosphere, and reinforces the rate of climb. Under suitable conditions, a glider pilot can use a thermal to gain height, and sometimes, extend the flight over a considerable distance by hopping from one thermal to the next.
Although a thermal column is not a particularly important event in weather terms, it tells us a lot about the aerial environment, and how it changes from day to day. Since the air temperature usually falls with increasing height, the atmosphere is fundamentally unstable. When a body of warm air starts to rise, the process may be self-sustaining, because warm air is less dense and tends to burst through the cooler air above. The effect is compounded by the energy released during vapour condensation, and in some circumstances the resulting cloud system will balloon out of all proportion to the original disturbance. As we’ll see later, this is the mechanism that triggers the development of thunderstorms together with the hurricanes and typhoons that form over the Atlantic Ocean and the Pacific Ocean. It also influences the behaviour of weather fronts.
Fronts
In this sense, atmospheric conditions are influenced by the earth’s surface below, and this is true on a wider scale. For example, within the temperate zone, the sea is cool and wet during the summer, while the land is relatively warm and dry. Hence the atmosphere can be divided into air masses of the order of 1000 km across which tend to persist as distinct bodies of fluid, for example, one over the North Atlantic and the neighbouring air mass over North America.
Inside each air mass, the temperature is almost uniform, and it is a striking fact that neighbouring air masses do not readily mix. To see why, we’ll look more closely at the interface, which slopes at an angle to the horizontal, and in plan, may measure several kilometres from its leading edge to its trailing edge [9]. The boundary is called a weather front and it’s along such boundaries that much of the world’s weather activity takes place. Each front separates a cool area from a warmer one: if the cool air mass is penetrating into a warmer one, the front is labelled as a cold front. If the warm air mass is penetrating into a cooler one, it is called a warm front (figure 11).
Figure 11
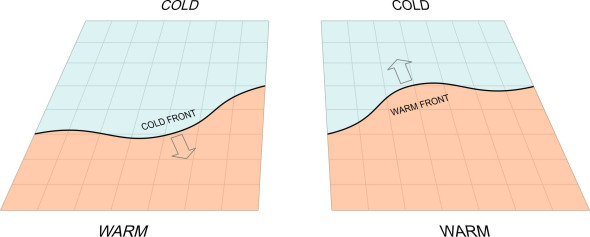
A warm front slopes up gradually at an angle of around 1:200 (vertical to horizontal). The reason is that because it is less dense, the warm air rides up over the cold air ahead. By comparison with a warm front, a cold front is steeper: with a slope of 1:50 to 1:100, and the cold air tunnels under the warm air mass instead.
In each case, the passage of the front is marked by a pressure change, a change in moisture content, and precipitation. A warm front produces a thin layer of stratus cloud condensing out of the warm air as it rises over the cool mass. By contrast, in a cold front, it is the cool air mass that is moving forward, and it encounters relatively warm ground as it does so. Hence the air is heated from below, and produces unstable air columns that in turn lead to cumulus cloud that are often associated with thunderstorms.
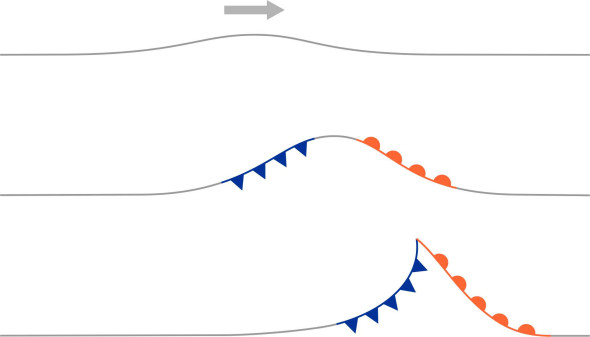
Interestingly, cold fronts move faster than warm fronts. The reason is that as the warm air rises, it has the effect of reducing the pressure below, drawing the cold air towards the boundary. So at ground level, the boundary progresses towards the warm air mass rather than the other way around, and instead of mixing, the air masses rub against one another, and the shearing action ruffles the edges. Any shearing action will cause the boundary to deform into a series of waves known as Kelvin-Helmholtz waves (see Figure 21 in Section F1917). Figure 12 shows a ‘bulge’ where the warm air mass intrudes a short distance into the cold one.
Figure 12
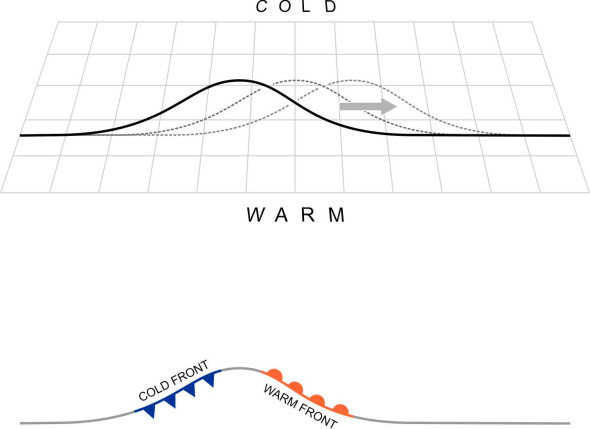
The bulge is being carried eastward by the prevailing wind, so by definition, the right-hand flank is a warm front, signified by the semi-circles attached to the dark line in the diagram. The left-hand flank is a cold front, signified by the triangles attached to the dark line. These are the familiar symbols for hot and cold fronts that appear in the weather charts on TV. Since cold fronts move faster, the left-hand flank of the bulge in figure 12 will close upon the right-hand flank as shown in figure 13 – in effect the cold front begins to catch the warm front, and at the apex, the two fronts combine.
Figure 13
Cyclones and anticyclones
Where the two fronts meet, the rising current draws air towards the apex of the wave at surface level, generating a roughly circular area of low pressure called a depression or cyclone. In the northern hemisphere, the Coriolis effect causes the air flow to veer to the right of the pressure gradient, spiralling anticlockwise around the low-pressure sink at the centre (figure 14).
Figure 14
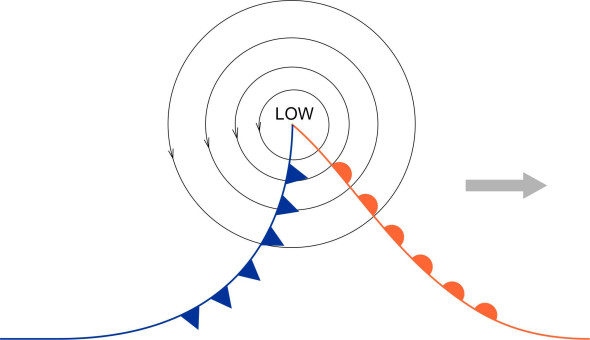
The Coriolis force is so powerful that the motion is almost exactly perpendicular to the pressure gradient, with streamlines that closely follow the isobars (Vanyo 01 p343). Carried by the prevailing wind, systems of this kind tend to move eastwards, bringing clouds and rain over the Atlantic and Pacific to the hinterland along the west coast of North America and Europe. Each depression has a limited life, decaying when the cold front catches up with the warm front, and typically, it takes two to three days to pass over a given location.
In the tropics, it is possible for a cyclone to reach a diameter of 1000 km. Those occurring in the North Atlantic are called hurricanes, while those in the North Pacific are called typhoons. What causes the high wind velocity is the angular momentum stored in the whole air mass before the storm begins. Several hundred kilometres across, the air mass is turning steadily in line with the earth’s rotation, and by virtue of the Coriolis effect, this momentum converges on the axis of the storm as the air is drawn inwards (figure 15).
Figure 15
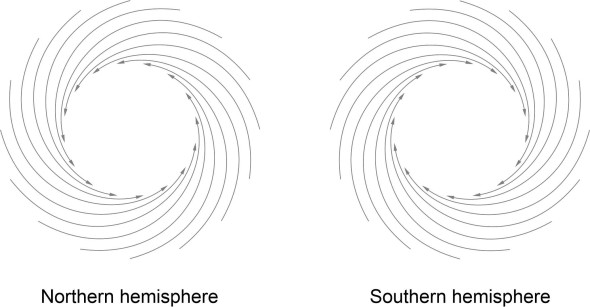
The incoming air parcels orbit around the core on a spiral path, but individually, they don’t spin: like a compass needle, each parcel remains oriented in a fixed direction, so that the inflow conforms approximately to a free vortex. In the northern hemisphere, air parcels reach speeds of up to 250 km/hour around the storm centre before exiting via the rising column. In the southern hemisphere, the direction is reversed.
But compared with that of the thermal current described earlier, there is a difference in the pattern of air movement at the core. The rotation creates a centrifugal force that prevents the spiralling air current from reaching the central axis.
Figure 16
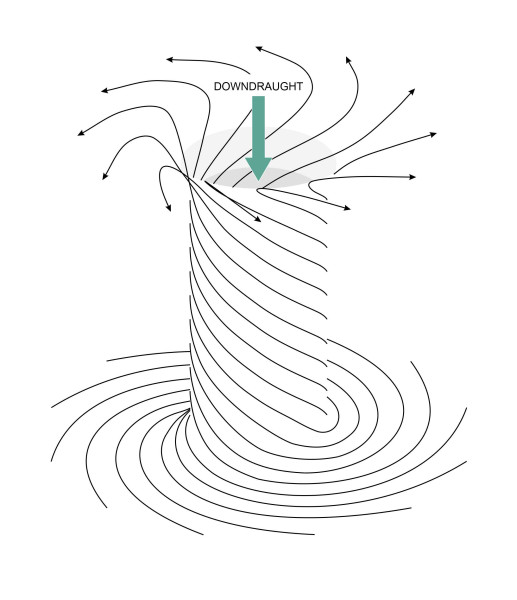
As shown in figure 16, this leaves a central region where the wind speed is relatively low. Measuring just a few kilometres across, it is called the eye of the storm. The low pressure inside the eye draws air down from the stratosphere above that is absorbed into the surrounding ‘wall’ where the wind speeds are highest. The danger to aircraft arises mostly from the towering mass of cloud and rain above, which may extend vertically as far as the stratosphere to a height of 15 km or more.
In contrast to a cyclone, an anticyclone is an area of high pressure that forms when a large mass of air subsides from the upper atmosphere. It is larger than a cyclone, up to 3000 km in diameter (figure 17), and it produces low winds that spiral radially outward, rotating clockwise in the northern hemisphere.
Figure 17
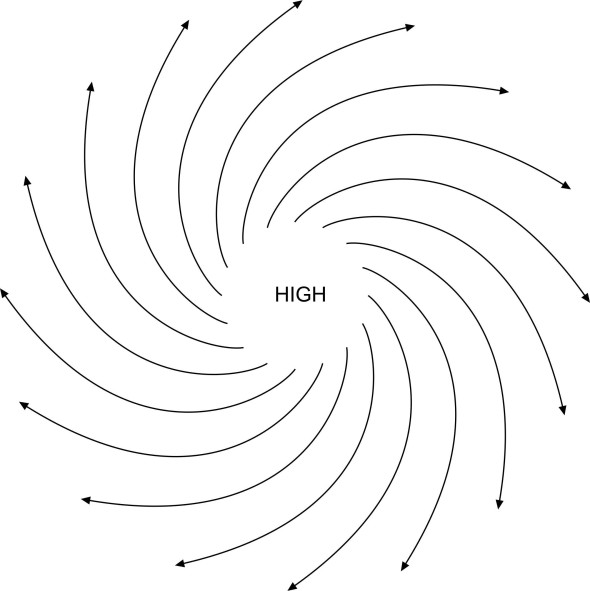
The air mass compresses and warms up as it sinks, so there is little cloud formation at this stage. The result is dry weather that may last for several days or weeks, although thermals will form, and after a while, there is an increased risk of thunderstorms.
The jet streams
Finally, let’s turn to the jet streams. They are streams of fast-moving air that were discovered quite recently, when aircraft were able to fly at high altitude. There are two jets in the northern hemisphere, shown in cross-section in figure 18.
Figure 18
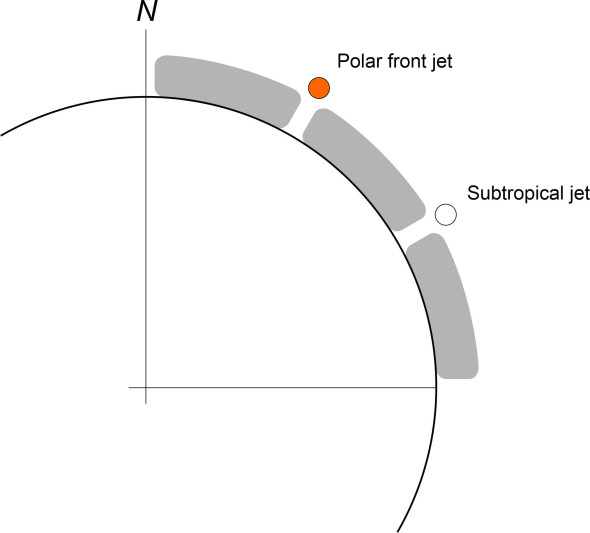
One is located within the upper lobe of the Hadley cell and the other in the corresponding lobe of the Ferrel cell. Additionally, there are two in the corresponding cells within the southern hemisphere. Each jet is several kilometres wide and a few thousand metres thick, its proportions resembling a flattened tube like a deflated bicycle inner tyre. Each follows a path that might crudely be described as a ring around the earth from west to east (figure 19), and all rotate in the same direction. Researchers have developed complex mathematical models to explain their behaviour, details of which you can find, for example, in [2]. Here, we’ll try to explain what happens in everyday language.
Figure 19
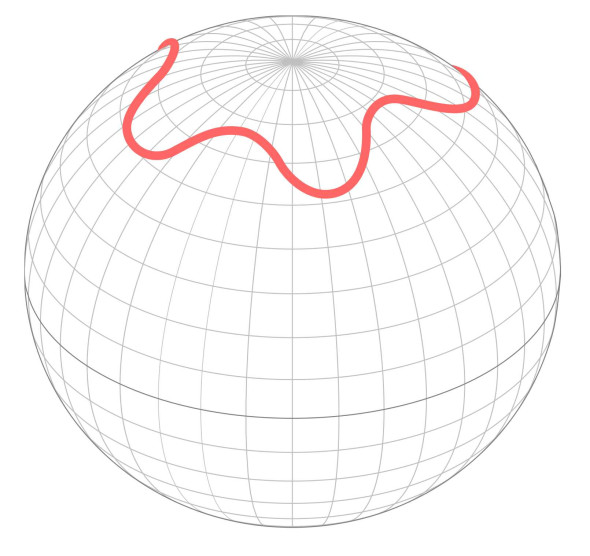
Meteorological observations have revealed that the jet streams they move with the seasons, and sometimes break up into smaller fragments. Here, we’ll focus on the more persistent ones. The jet closest to the equator is located at a latitude in the region of 25\({^\circ}\). It’s called the subtropical jet, and it is driven largely by the Coriolis effect. We have already seen how the air circulates within the Hadley cell: each parcel of air starts off on the ground surface at the equator, where friction is carrying it from west to east at the same speed as the earth’s rotation, around 464 ms\({}^{-1}\). It rises and travels at high altitude northwards to the boundary with the neighbouring Ferrel cell, where the tangential velocity of the earth’s surface is somewhat reduced, to about 402 ms\({}^{-1}\). Assuming our air parcel retains its original momentum, it will now be travelling at a velocity of 62 ms\({}^{-1}\) relative to the ground below, a considerable speed equivalent to about 224 km/h or 140 mph.
The polar front jet is harder to explain. It is borne on the surface wind of the Ferrel cell where it rides over the edge of the neighbouring polar cell as shown earlier in figure 18. It is stronger but less stable than the subtropical jet, with a path that follows the meandering cell boundary at a latitude that varies between 40\({^\circ}\) and 60\({^\circ}\), propelled by the sharp temperature difference across the boundary. Note that the Coriolis acceleration is stronger at this latitude (\(\phi ={\rm \; }60{}^\circ\)) than it is for the subtropical jet: for an air particle located anywhere on the earth’s surface in the northern hemisphere, its value \(a_{Cor}\) is given by the equation
(6)
\[\begin{equation} a_{Cor} \; =\; 2\Omega v\sin \phi \end{equation}\]where \(\Omega\) is the earth’s rate of rotation in rad s\({}^{-1}\), and \(v\) the velocity of the air parcel under consideration in m s\({}^{-1}\).
It wasn’t until 1939 that Carl-Gustaf Rossby detected the presence of systematic meanders in the path of each polar front jet. The meanders vary from season to season with anywhere between 3 and 7 loops that move slowly eastward across the globe [2]. In some ways, the process that drives the Rossby waves resembles the process that drives ocean waves across the sea surface. Friction between the air masses on either side renders the interface unstable, and once a bulge has formed, it doesn’t immediately collapse and spread itself uniformly around the globe, but propagates steadily in a given direction. From time to time, the tip of a bulge will break away to produce a separate column of rotating air. It is this fragmentation that results in the revolving weather patterns mentioned earlier that are typical of the temperate zone.
Hazards for aircraft
Having touched on weather systems on different scales, we can turn to the conditions that an aircraft might encounter on a routine flight. Cruising high above the above the clouds in a comfortable seat, it’s hard for an airline passenger to appreciate that flying is more sensitive to disturbances in the atmosphere than almost any other mode of travel. From the pilot’s point of view, the most important factors are visibility, cloud ceiling, and wind, together with specific hazards such as turbulence, icing, and fog.
Wind and turbulence
In daily life, we picture the wind as a steady flow of air parallel to the earth’s surface, in a more-or-less fixed direction. A steady wind is not usually dangerous: it carries the aircraft along without affecting the aerodynamic forces that occur during normal flight, so the pilot doesn’t need to worry about losing control. Abrupt changes in the wind speed or direction are a different matter: they are most likely to occur in the earth’s boundary layer within 1000 m from the ground, where the flow is disturbed by friction. They can cause a ‘jet upset’, by creating a sudden loss of lift or a sudden change in pitch when taking-off or landing.
There are several types of atmospheric disturbance that can affect aircraft, among them being
- thermal currents rising over warm ground,
- warm air rising over a cold weather front,
- air currents rising or falling over hills and mountains, sometimes referred to as orographic effects,
- turbulence.
The first three are covered in the flight manuals specially written for air pilots, and we won’t go into detail here. Instead, we’ll focus on turbulence.
Turbulence is a general term for what happens in a fluid flow that is swirling and chaotic rather than smooth and steady, a phenomenon that occurs on many different scales in the atmosphere. Let’s start with events on a large scale, maybe several kilometres across. Imagine two layers of air, one on top of the other. They are both moving horizontally in the same direction, but the upper layer is moving faster, rubbing across the top of the lower one. As with the boundary between neighbouring air masses as described earlier, both surfaces become ruffled, forming a series of undulations known as Kelvin-Helmholtz waves. The waves then break up into a turbulent row of eddies that initially may be quite large relative to the depth of either layer. It is tempting to think of turbulence as a ‘random’ process, but it’s not the same kind of randomness that you see when rolling a dice, or watching the decay of radioactive particles. In fluid motion, the particles form a continuum. They’re not free to move in any randomly chosen direction, because their motions are connected. All one can say is that for the moment, we don’t really understand turbulent flow. What we do know is that the eddies tend to evolve over time, diffusing and breaking down into smaller ones. What matters for an aircraft is turbulence on a scale that is roughly equivalent to its wing span or the length of the fuselage, and it is on the fringes of a jet stream at an altitude of between 6,000 and 15,000 metres that eddies on this scale are likely to occur. Relative to the surrounding atmosphere, the core of the jet stream may be travelling at 200 km/h or more, causing what is known as Clear Air Turbulence (CAT) around the periphery that can, for example, shake the tail of an airliner from side to side and throw passengers around the cabin who are not strapped into their seats. The conditions that lead to CAT can be forecast – for example, it is stronger and more prevalent in winter - but the eddies themselves cannot yet be detected in advance by an approaching aircraft. As we’ll see later in Section A0415, if turbulence can’t be avoided, the pilot can only reduce the impact by slowing the aircraft down.
Clouds and precipitation
To a meteorologist, clouds provide useful information about what is happening in the atmosphere. To an aircraft pilot, they are a flight hazard. A cloud usually begins with the evaporation of water from the surface of the sea. Initially, it takes the form of a gas whose molecules mix freely with the molecules of oxygen and nitrogen within the atmosphere. As such, the water vapour is invisible, but there’s a limit to the amount that the atmosphere can absorb in this way. Typically, it is about 4% by volume, and it varies with temperature. It doesn’t turn into a cloud until the air cools and becomes saturated, or in technical terms, reaches its ‘dewpoint’. Hence, clouds may form at different levels, which are designated as ‘high’, ‘medium’ or ‘low’ accordingly. Today, different organisations fix the boundaries between the three categories at slightly different altitudes. Here, we’ll follow the ones set out by the UK Meteorological Office [18].
What’s important is the base of the cloud rather than its top. The position of the cloud base depends on how much water vapour is contained within the rising air mass. Low clouds form when the vapour condenses into microscopic water droplets relatively soon after leaving the surface, having a base below 6,500 feet (around 2,000 m). Medium clouds form higher up, between 6,500 feet and 20,000 feet, where the temperature is below freezing, so the water droplets are supercooled; they are liquid but will freeze on impact with a solid surface. High clouds are formed altitudes above 20 000 feet where the temperature falls to -20\({^\circ}\)C or below. They consist mainly of ice crystals, and it’s these ice crystals rather than water droplets that billow up into the stratosphere to form spectacular cloud patterns like the cumulonimbus shown at the beginning of this Section.
Clouds can take on different forms, but in 1802 the English pharmacist Luke Howard [8] was distinguished three basic shapes whose names persist to the present day:
- Cirrus clouds are white, curling wisps made from ice crystals.
- Cumulus clouds are ‘heaped’ clouds having a flat bottom and white cauliflower tops that in some varieties can reach up to the stratopause and beyond.
- Stratus cloudsconsist of a single layer, either of closely-spaced clouds, or a featureless haze.
These can be broken down into sub-categories, so that altogether, there are 10 varieties of cloud commonly recognised by weather forecasting agencies. Their names are formed by combining the names of the above shapes in different ways, together with the prefix ‘alto’ to denote clouds at the middle level between 6,500 and 20,000 feet (there is no special prefix to denote a high or a low cloud). In addition, the term nimbus, used as a prefix or a suffix, indicates precipitation. Alternatively, each cloud type can be designated using either an abbreviated label (for example ‘Ac’ for altocumulus), or a number code between 0 and 9 [18].
Clouds in four of these categories can have a significant impact on aviation: they are
- stratocumulus
- altocumulus
- nimbus
- cumulonimbus
They are illustrated diagrammatically in figure 20.
Figure 20
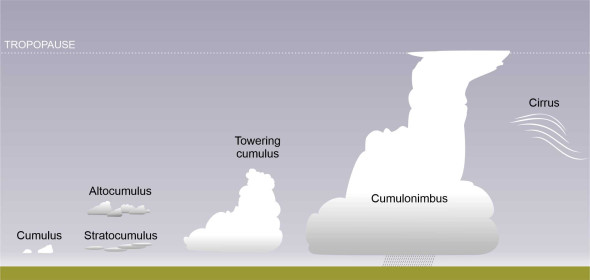
Altocumulus and stratocumulus clouds tend to arise in connection with a depression, where a warm air mass develops over a significant area and cools as it rises. Altocumulus can also develop over a warm front, while stratocumulus occurs in connection with a cold front. Either can give rise to turbulence, and as we’ll see later, either can cause icing. Nimbus cloud is the end-product of a rising altocumulus layer when it reaches saturation: the result is a dark, shapeless mass that delivers widespread precipitation. Raindrops can obscure visibility for the pilot but don’t usually damage the aircraft. By contrast, raindrops that are carried upwards inside the cloud may freeze and collect additional supercooled liquid droplets, growing in size until they are too heavy to be sustained by the rising air current. Then they fall as hailstones, some the size of golf balls, that can dent the aircraft skin, break a cockpit window, and damage antennae [12]. Cumulonimbus cloud is a more extreme variant in which the updraught at the centre the cloud may project almost into the stratosphere. More dangerous than any of these, however, is thunder cloud.
Thunderstorms
Thunderstorms often occur after a heat wave in summer. On any one day, they occur in large numbers, around 40 000 scattered across the globe. As with a hurricane or a typhoon, the trigger is a rising column of air that is warm and humid, conditions that often occur where wind converges in an area of low pressure such as a front, or ground that is heated during the daytime. The rising air current forms a tower of cumulus cloud. At the tropopause, the temperature of the atmosphere no longer falls with increasing height, so the cloud stops rising and spreads out instead. Because the wind is stronger here than it is close to the ground, the top of the cloud shears downwind to form an ‘anvil’ as shown diagrammatically in figure 21.
Figure 21
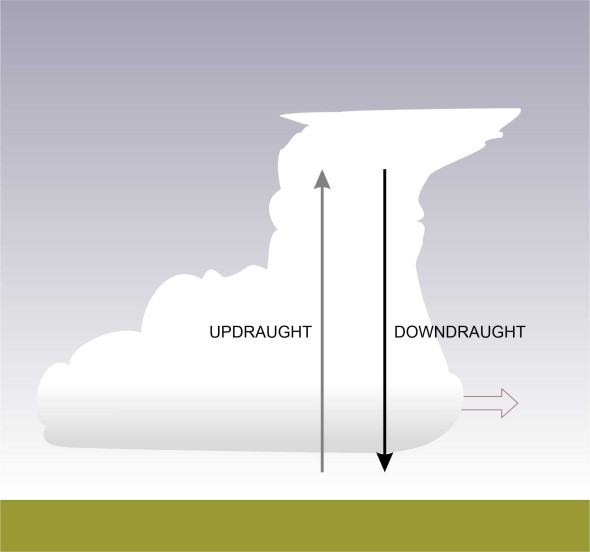
Inside the cloud, ice and water droplets condense from the rising air column and create a downdraught slightly ahead, falling at a rate of 15 000 metres per minute or more. A ‘cell’ created in this way will persist over a relatively short time span of about 30 minutes. Almost all thunderstorms have more than one cell, with new cells forming as the old ones dissipate.
Among the different kinds of cell is a short-lived but intense downdraught known as a microburst. It happens when the central column of the thunderstorm releases a mass of hail or raindrops that can no longer be sustained by the rising airflow, and as shown in figure 22, at the point where the downdraught reaches the ground it spreads out horizontally over an area in the region of 4 km across, about the length of a runway [11].
Figure 22
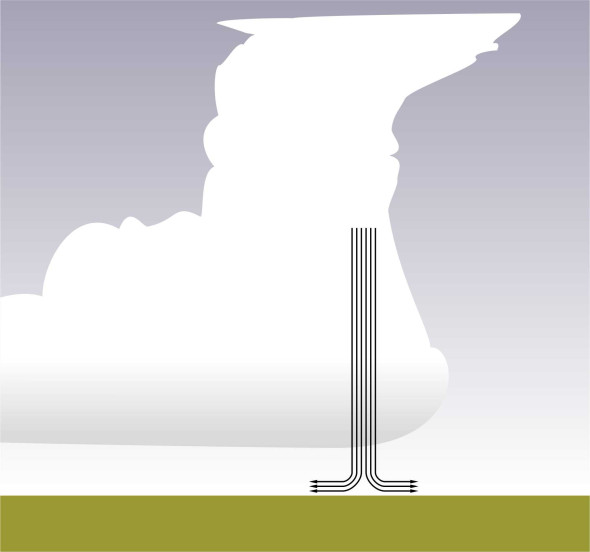
This results in a cool gust front ahead of the storm, which in turn causes (a) a sharp difference in wind velocity across the diameter of the affected area, together with (b) a sharp change in velocity with height known as wind shear. In this area, horizontal wind speeds can reach 150 km/h.
A microburst is a fleeting phenomenon that is difficult if not impossible to forecast. It is also difficult to detect when it actually happens. Multiple microbursts following one another in the same area are common. Overall, the effect for a low-flying aircraft during take-off or landing is a sudden increase or decrease in the air flow over the wings, with a corresponding increase or decrease in lift. This may cause it to rear up or plunge down when close to the runway. In the past, abrupt wind gusts of this kind have caused serious accidents, and we’ll look at the way pilots are trained to deal with the situation later, in Section A0415.
Associated with the thunderstorms that occur around the globe, there are said to be about 9 million lightning flashes every day [17]. Lightning is generated by a powerful updraft within a cumulonimbus cloud. Carried within this central air column are super-cooled water droplets that collide with particles of hail falling in the opposite direction. While the details are still a matter for scientific investigation, the collisions result in the transfer of electrons to the hail particles from the droplets so that a positive charge tends to build up at the top of the cloud while a negative charge builds up at the base. The earth itself is essentially neutral, but positive charges are drawn to its surface underneath the cloud base, and eventually, the electrical tension produces a lightning strike. The strike is not a single event, but takes place in stages, beginning with an invisible downward-moving leader stroke [3] that lasts roughly a millisecond. It zig-zags downward in a forked pattern towards the ground, while at the same time, a positively charged streamer reaches up, and when they connect, an electrical current begins to flow, resulting in a flash of lightning that actually consists of several return strokes.
There are variations on this sequence, because lightning can travel between clouds as well as between a cloud and the ground, and the current sometimes flows in the opposite direction to the one just described. But from the point of an aircraft pilot, the key facts are as follows. An airliner will be struck by lightning on average about once a year [11]. Most such strikes are attracted towards the metal shell of the aircraft as the path of least resistance, and they can produce a pinhole in the fuselage, usually at the nose or tail. The current does not threaten passengers, because its pathway lies along the outside of the fuselage, which forms a protective cage.
Icing
Hail is just one of the reasons why pilots generally avoid flying through clouds. There are others. In the past, a related phenomenon called icing has been responsible for some severe accidents. When flying inside a cloud of medium height, a layer of ice can build up around the leading edge of an aircraft wing that adds significantly to the vehicle weight and disturbs the pattern of air flow [10]. Even a thin layer, around the thickness of sandpaper, can increase drag and also reduce the lift by 30%. Usually, the ice is created from super-cooled raindrops that persist in sub-zero temperatures, but in fact, the temperature doesn’t have to be below freezing. When the air flows over an aircraft wing, there is a sudden drop in pressure above the leading edge, where the temperature falls and moisture condenses. The droplets are ‘super-cooled’ and freeze instantly on impact to form a layer that clings to the surface.
Contrary to what one might expect, icing rarely occurs at high altitudes or at high aircraft speeds. In very cold air at temperatures below -40\({^\circ}\)C, there are no water droplets, only crystals of ice, and since they do not form a coating, the aircraft’s de-icing system is not needed. And at speeds above 575 knots, friction warms the wing surface a little, and icing is negligible. This is important for commercial aircraft such as passenger jets, which fly at speeds approaching the speed of sound, and at altitudes above the level at which icing is a serious problem. However, all air journeys start and finish at ground level, and an aircraft may encounter icing in a thunderstorm during the landing approach, or during the climb after take-off.
Other hazards
There are objects in the atmosphere we can’t see from the ground, some of them floating as high as the tropopause and beyond. Some can be sucked into an aircraft engine. Material sucked into a gas turbine can cause engine surge. If it blocks or partially blocks the flow of air into the fuel chamber, the pressure of the incoming stream falls, and the burning exhaust gas blows back through the engine. The engine ‘flames out’, and since it cannot burn without oxygen, it stops. This is one of the reasons why commercial aircraft have two or more engines.
Dust in the atmosphere rarely causes an engine surge, unless it comes from an erupting volcano (figure 23). Volcanic ash consists of pulverised minerals such as silica.
Figure 23
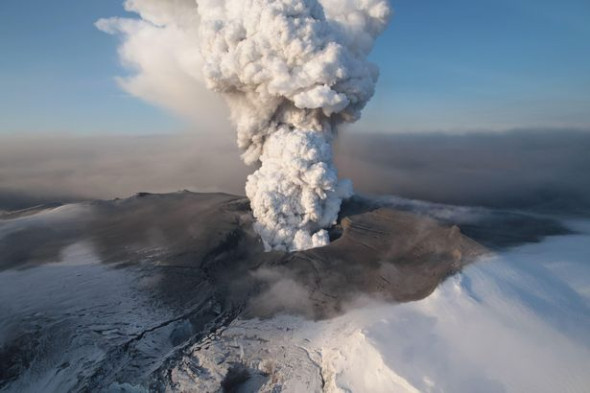
It is abrasive, and can damage the compressor blades. Worse, any material that gets through to the combustion chamber will melt and leave a glassy coating on the turbine blades. If badly affected, the aircraft will lose power and begin to descend. Assuming the encounter takes place at cruising altitude, the engines will cool during the descent so the volcanic glass hardens and spalls away, allowing partial or complete power recovery. In 1982, all four engines of a British Airways 747 stalled at 11 000 m when it ran into a plume rising from Mount Galunggung in Indonesia. Captain Eric Moody famously announced to the passengers ‘We have a small problem…’. The plan was to glide to an airport 100 miles away, but the engines re-started at 3 700 m [6] and the pilot regained full control. Engine surge is not the only probem: volcanic ash can abrade the cockpit windscreen, and clog the hydraulic controls together with flight instruments and navigation systems. You may remember theeruptions of Eyjafjallajökullin Iceland in 2010: it didn’t cause any accidents but it closed airways over much of Europe and disrupted air travel for a week.
There’s lots of life up there in the atmosphere: a surprising number of biological species in fact. Among the smaller species are microscopic ‘aeroplankton’ (microbes, fungal spores, pollen, and seeds), together with insects and spiders. They won’t damage an aircraft, but they are a nuisance inasmuch as they affect its aerodynamic efficiency because they stick to the wing surfaces on impact. Normally, the air flow over an aircraft wing is laminar at the leading edge and becomes turbulent by the time it reaches the trailing edge. The problem is that ‘bug spots’ roughen the wing surface and promote an early transition to turbulent flow and hence greater drag. There seems to be no practical remedy.
By contrast, birds constitute a significant risk. Aircraft run into them quite often: between January 2000 and January 2009, there were nearly 100 000 ‘bird strike’ reports filed in the Federal Aviation Administration database [5]. The ones that pilots most worry about are those with heavy bodies that flock close to the ground. It is while the aircraft is taking off or landing that most strikes occur, and they are dangerous because the weight of a large bird slamming into the compressor blades of a gas turbine can damage or even destroy the engine. For many years, seagulls have been a problem at JFK airport [16]. In 1995, a Concorde supersonic airliner ‘absorbed’ a goose, which destroyed two engines at a cost of $9 M. Ironically, Canada geese were brought to the eastern seaboard of the USA by wildlife agencies and encouraged to breed there permanently by clipping their wings. Young birds then returned to the same spot during the annual migration cycle, and became a pest – they were the cause of the extraordinary ditching of Flight 1549 in the Hudson River [4].
In many ways, jet aircraft benefit from flying high where there is less aerodynamic drag, less turbulence, and less likelihood of running into a cloud. But at high altitude, a new challenge emerges, that of radiation. There are three main categories:
- solar wind,
- coronal mass ejections (CMEs) and flares,
- galactic cosmic rays (GCR)
The solar wind is a steady flow of charged particles (mostly protons and electrons) from the sun’s corona, while coronal mass ejections and flares are intermittent events. CMEs are more difficult to detect, but they create more disturbance; they carry a magnetic field that induce surges of electrical current in long power lines that lead to blackouts, as in Quebec in 1989. They can also damage satellites. Galactic cosmic rays (GCR) originate in distant supernovae, but their intensity varies with the sun’s sunspot cycle. Like CMEs, they are associated with strong magnetic fields. All these phenomena affect flight operations, interfering with GPS systems and other electronic instruments, and exposing passengers and crew to radiation, especially during high-altitude polar flights [20].
Conclusion
To summarise, atmospheric conditions affect air travel in several different ways. Not all the effects are negative. Aircraft flying at high altitude from west to east in the northern hemisphere can exploit jet streams to increase their land speed and significantly reduce their journey time without burning extra fuel. On the negative side, high temperatures mean warmer (and therefore less dense) air, which makes it more difficult for planes to take off and land. And extreme weather patterns force pilots to alter their flight plans: a thunderstorm near an airport can effectively bring the operations to a halt for a while, with knock-on delays that spread throughout the system.
And significantly, the process of cause and effect is not entirely one-way. Air travel itself affects the weather, in the sense that commercial aircraft contribute to climate change. It seems that radical measures are needed to reduce the industry’s carbon footprint, and at the time of writing, it is not clear how the industry will respond. This is a topic somewhat outside the scope of our web site, so in the remaining Sections we shall continue to focus on the aerodynamic forces that support a flying machine, how the pilot controls its course, and how its speed must be maintained within a certain range so it doesn’t fall out of the sky.