
© Passenger jet taking off. Photo by Barry Duffield Photography
A.1816
Lift
‘The airplane did more for science than science ever did for the airplane’
At any given moment, there are millions of vehicles moving around our planet. They move in different ways in different surroundings, but with a few exceptions, all have one thing in common: they operate within the earth’s gravitational field and their weight must somehow be carried to the ground. Ships and aircraft are distinguished by the fact that the load is not transmitted to the ground directly, but through a fluid medium. In fact, aircraft are supported by the atmosphere, and whether the atmosphere can hold them up depends on how fast they are moving. When an aircraft stops, it drops. In the past, no-one really understood how the wings created lift, and even today, some are questioning whether there is a simple explanation, or at least one that can be understood without resorting to mathematical formulae [22] [14]. We introduced the problem earlier in Section F1816, and here, we’ll fill in the details and sketch the development of aerofoil theory over the last hundred years or so.
How does an aircraft fly?
A balloon will float above the ground if it weighs less than the air it displaces. It’s a matter of buoyancy. But heavier-than-air machines need some other means of support. There are only two ways in which the atmosphere can apply forces to the wings or indeed any part of the structure. We call them (a) normal pressure and (b) shear stress. Normal pressure acts at right-angles to the wing surface, while shear stress is a kind of friction, in which the air rubs along the surface like a piece of sandpaper. It’s the normal pressure that delivers most of the lift, but compared with the water pressure on a ship’s hull, say, it’s not a very powerful force and it’s not easy to quantify.
A historical puzzle
The support doesn’t come as much from below as from above. Take a heavy aircraft such as a 400-tonne Boeing 747 airliner. While it’s stationary on the ground, the pressure acting on the upper surface of the wing and the pressure acting on the lower surface are the same, and equal to the local atmospheric pressure. In flight, the pressure on the upper surface falls, while to a lesser extent, the pressure on the lower surface rises, and it’s the difference between the two that keeps the machine aloft. A fully loaded 747 weighs around 400 tonnes, but assuming a wing area of 540 m\({}^{2}\), the pressure difference averaged over the whole surface is small, less than one tenth of a standard atmosphere.
So where does the pressure difference come from? It’s a question that has long preoccupied scientists and engineers. Centuries ago, visionaries such as Leonardo da Vinci dreamed of machines that floated through the air or flapped their wings like a bird. One of the first to think seriously about the forces involved was Isaac Newton, who believed that the air was made of particles that move independently like rubber balls, bouncing off any solid surface that lies in their path. By working out the rate of impact on an inclined plate, Newton was able to predict the lift as a function of the angle at which the wing is inclined to the oncoming flow [3]. We now know that except at very high altitudes, the atmosphere doesn’t behave like this. It’s true that the molecules in a gas are continually in motion. They dart about in all directions, even when they’re packed into a sealed container such as a pneumatic tyre. But they are not free agents: they bump into each other far more often than they bump into their surroundings. So when we examine the flow round an aircraft wing, rather than individual molecules, it is helpful to picture the air in terms of aggregates: groups of molecules moving collectively in a particular direction. In this Section, we’ll call them parcels. Newton’s successors treated parcels of air and water as a continuum, but their behaviour couldn’t be explained in mathematical terms unless the rules that governed the interactions between the parcels were greatly simplified. The result was a fascinating concept: the ‘ideal fluid’. It was slippery stuff – it couldn’t exert lift or drag on a moving body, a paradox that preoccupied scientists for over a hundred years and did nothing to encourage the development of flying machines. You’ll find more on this paradox in Section F1918.
So where does aerodynamic lift come from? Many explanations hve been cited, and here we’ll mention just one. It focuses on the difference in curvature between the upper and lower surfaces of the wing as portrayed in figure 1.
Figure 1

The upper surface arches upwards while the lower one is almost flat. The parcels of air that travel over the wing have a slightly longer journey, and must move faster than those that pass underneath if they are to arrive at the trailing edge at the same time. Then Bernoulli’s Law tells us that the pressure over the upper surface must fall. We have no reason to doubt Bernoulli’s Law, but it’s not obvious why the parcels should keep in step. In fact, experiments have shown that the air passing over the top moves more quickly and reaches the trailing edge sooner [11]. Nor is the arch essential: a flat plate will generate lift as long as it’s inclined at an angle to the oncoming air flow with the leading edge uppermost.
The inclined plane
Maybe we should look more closely at the behaviour of an inclined plane. During the nineteenth century, George Cayley, who built model gliders that were strikingly similar to modern aircraft, was convinced that the inclined plane was the ‘true basis of aerial navigation’ [13]. One can argue that it pushes the approaching fluid parcels down: the lift is an equal and opposite reaction to the downward force that the wing imposes on the air.
Figure 2
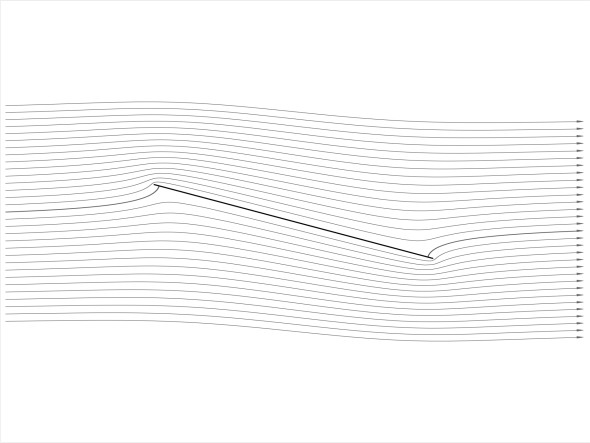
But the action is more subtle than you might expect. Assuming an ideal fluid, figure 2 shows the pattern of movement over a flat plate inclined at an angle of 15\({^\circ}\) to the oncoming flow. It was derived using a mathematical transformation that we’ll outline later. The fluid parcels divide into two streams at the front. At the point of division the local velocity is zero and the pressure rises to a maximum: it is called a stagnation point. Notice that the wing doesn’t split the air like a knife cutting into butter. The stagnation point lies below the leading edge so the upper stream must make a detour, turning upwards and curling around the leading edge before continuing its journey along the top. Intuitively, this may seem odd, but it’s what the mathematics predicts for an ideal fluid. To see why, imagine an experiment in which the plate is inclined at an angle \(\alpha\) to the flow. With the angle set initially to 90\({^\circ}\), symmetry requires the front stagnation point to be located at the mid-point of the plate as shown in figure 3. When \(\alpha\) is reduced, the oncoming stream of air ‘sees’ an obtruction and divides unequally above and below. Hence the stagnation point moves forward, but it doesn’t reach the leading edge until \(\alpha\) is zero.
Figure 3

Now, the upper stream is propelled over the nose by the high pressure at the stagnation point, and it accelerates as it rises over the leading edge. Here, we observe something peculiar. Air parcels within the atmosphere can’t grip their neighbours or make them rotate. The result is they deform in a way that is unique to inviscid fluids. Parcels on the inside of the curve speed up relative to those on the outside, and the streamlines squeeze together more and more tightly until the flow approaches a singularity at the tip. In theory, the velocity is infinite, but in practice the process results in very high speeds near the leading edge. When speeds rise, the pressure falls, and this is the place on the wing surface where the pressure reaches its lowest value. The effect is shown in figure 4, which is an enlarged view of the front part of the plate shown in figure 2.
Figure 4
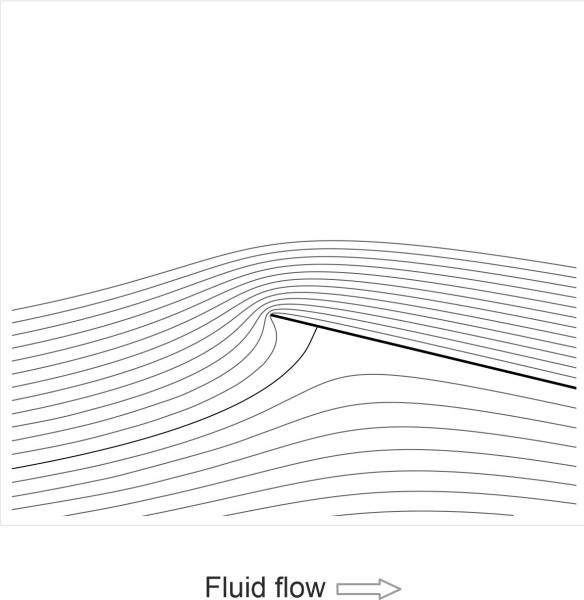
In an ideal fluid, the low pressure applies a vertical lift force near the front of the wing that is concentrated over a relatively small area. But the same argument applies to the stream of air that passes underneath the wing as well, not at the front of the wing, but at the rear. The parcels undergo the same sequence of events but in the reverse order, so it would be more correct to describe the pattern as antisymmetrical - the streamlines are squeezed together under the wing below the trailing edge. When the air parcels reach this point, their velocity reaches a maximum and the pressure a minimum, so they exert a downward force that (in theory) exactly counterbalances the upward force at the leading edge. Friction-free fluid produces zero lift.
Breaking the symmetry
In the real world, however, the outcome is different. Imagine two air parcels labelled ‘A’ and ‘B’, which begin their journey around the wing simultaneously, starting from a point close to the stagnation point under the leading edge. Parcel A travels over the top of the plate, while parcel B travels underneath. Each makes a journey that consists of two stages. Parcel A starts by turning upwards, towards the leading edge. It is pushed from an area of high pressure to an area of low pressure above, accelerating to a high speed at the tip. During the second stage of its journey, it travels along the upper surface of the plate. Here, the pressure starts to rise again, and the adverse ‘pressure gradient’ slows the parcel down. In a real fluid, the parcel is also affected by friction, and struggles to reach the aft stagnation point near the trailing edge.
Meanwhile, parcel B undergoes a similar sequence of events but in reverse. First, it is propelled by a favourable pressure gradient along the under-side of the wing, but owing to friction with the plate surface, loses some of its momentum in the process. What happens next is pivotal. During the last stage of its journey, parcel B is expected to travel from the low-pressure region under the rear part of the wing and around the trailing edge to the high-pressure region above, where the stagnation point lies. This phase of the journey corresponds to the journey of parcel A away from the stagnation point under the leading edge, except that parcel B is moving in the opposite direction, against a rising pressure gradient. Any shortfall in momentum turns the rising pressure gradient into a barrier, and instead of curving upwards around the trailing edge, parcel B breaks away and drifts astern into the wider flow field.
Figure 5
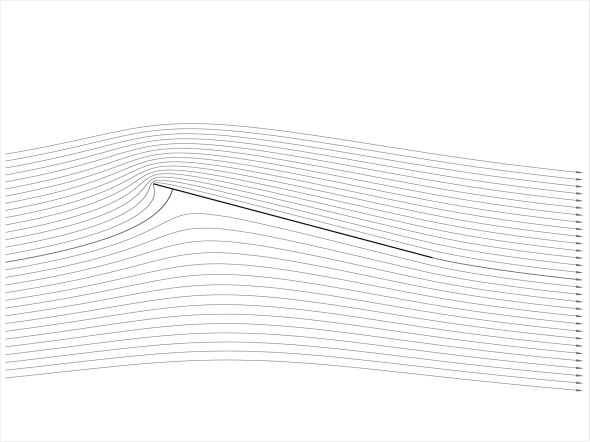
As a result, the aft stagnation point moves to the trailing edge as shown in figure 5, no longer impeding the progress of particle A. Hence the air moves faster over the upper surface than the lower one, and since the difference in speed creates low pressure over the leading edge but not under the trailing edge, there is net lift.
There are two possible objections to this argument. The first is that most wings have a rounded nose, which changes the flow pattern by smoothing out the fluctuations in velocity and direction of motion of the air parcels close to the leading edge. However, this doesn’t rule out friction as the cause. Consider the elliptical profile shown in figure 6, which has a curved leading edge and a curved trailing edge as well.
Figure 6
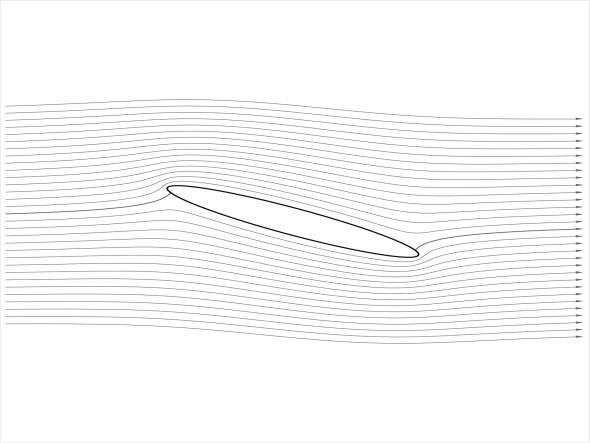
Again, the ideal flow pattern is anti-symmetrical, and the effect of friction between the air and the wing surface over which it moves is no different from the effect that occurs with a flat plate: in reality, the lower air stream will lose energy before breaking away at the trailing edge, so the air moves faster over the upper surface.
Another objection is that most aircraft wings are not symmetrical. Unlike the flat plate and the ellipse, they have an arched profile in the sense that the curvature of the upper surface is more pronounced than the curvature below, so our simple chain of logic based on the breakdown of symmetry does not apply, and in fact an alternative theory enters the picture. It has been claimed that the arch causes the streamlines to squeeze together over the top of the wing to a greater degree than they do underneath. Assuming that their density remains virtually unchanged throughout, the air parcels moving over the top of the wing must speed up during the process, and the pressure must fall.
Figure 7
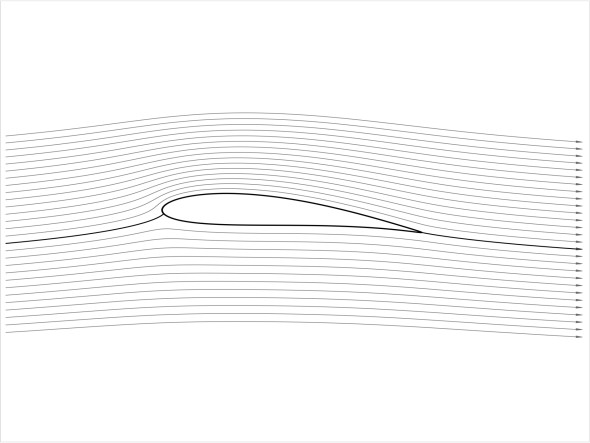
In fact the streamlines do squeeze together, as can be seen from the flow pattern shown in figure 7, but the mechanism doesn’t explain what is going on, because as any stunt pilot will demonstrate, the wing will generate lift even when the aircraft is flying upside down. Almost by elimination, we are left with friction as a key ingredient in the lift-making process. Accepting, therefore, that there is a difference in speeds, how does this help us to predict the amount of lift the wing will generate?
Flow round the wing cross-section
A difference in speeds between the upper and lower surfaces of a wing is essential for producing lift, but the connection between them is not obvious. How do we predict the one from the other? At the beginning of the 20\({}^{th}\) century, two pioneering mathematicians, working independently in two different countries, hit on the idea of circulation. They were the German scientist and engineer Wilhelm Martin Kutta (1867-1944), widely known today for his work on methods for solving differential equations, and Nikolai Egorovich Joukowski (1847-1921), who specialised in fluid dynamics and established the world’s first course on aviation at the Moscow Technical School.
Circulation theory
Their idea led to a beautiful theorem that predicts the value of the lift \(L\) if we know the strength of the circulatory component in the fluid motion, and it works for a cross-section of any shape. To start with, let’s clear up some definitions. The first concerns the direction in which the wing is travelling and its speed through the air. Aerodynamicists like to turn the problem around and think in terms of the speed and direction in which the air is travelling relative to the wing: outside the wing’s sphere of influence, the air parcels are assumed to move in parallel straight lines at a uniform speed called the free stream velocity, which we’ll denote by \(V\). The angle of the wing relative to the oncoming fluid is generally known as the angle of attack. Provided the fluid is inviscid and incompressible, and provided that the flow is uniform at points remote from the body surface (Munson et al 13 p316), then
(1)
\[\begin{equation} L\; =\; \rho V\Gamma \end{equation}\]where \(\rho\) is the fluid density, \(V\) is the free stream velocity, and \(\Gamma\) the circulation. Put crudely, the circulation parameter \(\Gamma\) tells us whether there is a bias in the fluid movement clockwise or anti-clockwise around the aerofoil, and if so, how much. To find its value, we divide the perimeter of the cross-section into small segments, work out the component of fluid velocity parallel to each segment, and combine the results. In Section F2019, the standard formula is set out in more precise mathematical terms:
(2)
\[\begin{equation} \Gamma \; =\; \oint \left(U\cos \beta \right)\, ds \end{equation}\]In fact, this is a general formula for working out the circulation around any closed curve within the flow field, not just a solid body.
Figure 8

As shown in figure 8, the symbol \(U\) stands for the velocity of the flow at any given point located at a distance \(s\) measured along the curve, while \(\beta\) denotes the angle at which the flow crosses it. The integral sign on the right-hand side indicates that for each segment, we multiply the quantity \(Ucos\beta\) by its length, repeat this for all the segments, and sum the resulting values. In the case of an aircraft wing, the fluid close to the wing is moving parallel to its surface, so \(\beta\) is zero everywhere. Equation 2 then reduces to
(3)
\[\begin{equation} \Gamma \; =\; \oint Uds \end{equation}\]Picture the aircraft from the port side, so the air is moving from left to right relative to the wing, and for any given point on the wing surface consider the velocity \(U\) as positive if it acts in an anticlockwise direction, and negative if it is clockwise. Then taking each segment in turn, we multiply the velocity by the length of the segment measured along the wing surface, add the results to get the total circulation \(\Gamma\), and substitute the result into equation 1 to get the lift. You may have noticed a remarkable fact: it’s not necessary to know the pressure of the air at any point on the wing surface, only its speed.
equation 1 says a great deal about fluid behaviour. In a very succinct form, it summarises the role of circulation in the behaviour of an aircraft wing, and seemingly, enables one to predict the amount of lift it can generate. So does the concept of circulation explain lift in a convincing manner? The opinion among experts is that it doesn’t (see, for example, [7]). Circulation is a theoretical construct, and it’s not obvious how fast the air should circulate nor indeed why it should ‘circulate’ around the wing at all. It’s not an explanation unless one can demonstrate where the circulation itself comes from and what determines its magnitude.
The Kutta condition
Earlier in this Section, we plotted the theoretical pattern of flow around a flat plate inclined at an angle to the free stream. In figure 9 you’ll see a close-up view of the streamlines where they gather tightly around the trailing edge.
Figure 9
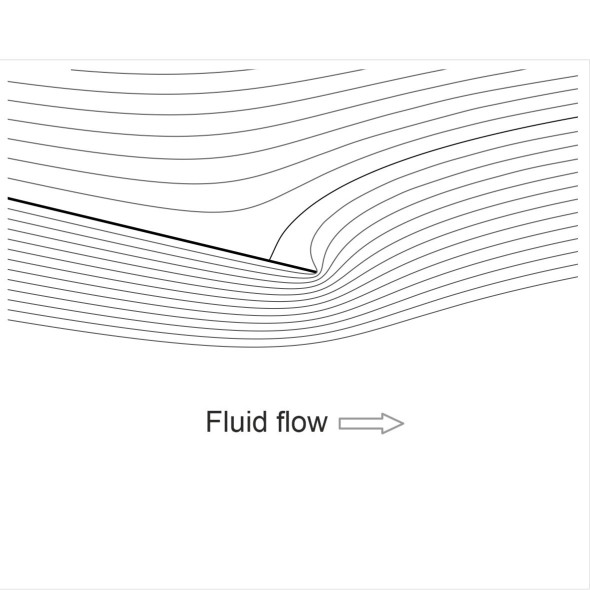
There is a singularity at the tip, where the velocity approaches infinity. This can’t happen in reality, and in 1902, Kutta laid down the conditions for a more realistic flow pattern in the aerofoil wake. Both the upper fluid stream and the lower fluid stream should exit smoothly, which requires the pressures to be equal where they converge, and in accordance with Bernoulli’s equation, the velocities must be equal too [10].
We can simulate the effect by superimposing a particular pattern of movement on the flow field – a free vortex. In a vortex, all the parcels travel in circular paths around the same origin. The velocity is inversely proportional to the radius \(r\) of the orbit, so the parcels close to the centre are moving fast, while those in the distant reaches of the flow field are almost stationary. Adding a vortex, therefore, causes the air to accelerate over the upper wing surface and decelerate over the lower surface without significantly affecting the more distant parts of the flow field, and the composite flow pattern exhibits a pressure differential that results in lift. It is an artificial device, but depending on how fast we want the parcels to circulate, we can make the vortex as strong – or as weak - as we please. Now the strength of a vortex is expressed in terms of its circulation \(\Gamma\), measured round a curve that encloses its central axis (any such curve will do – they all give the same answer). If we choose just the right value for the parameter \(\Gamma\), the aft stagnation point that occurs on top of a flat plate aerofoil migrates to the trailing edge and the singularity disappears. This was the method used to create the flow pattern shown earlier in figure 5, and it works for an aerofoil of any shape.
Today, the condition for a smooth exit flow is known as the ‘Kutta condition’. It’s not a theory, but an arbitrary adjustment that yields a more plausible flow pattern. Remember that we are adding potential flows together, none of which take into account the existence of friction – the vital ingredient that triggers circulation. When adjusted in this way, the composite flow field generates lift values that are close to the observed values for real wings.
Pressure on the wing surface
In principle, therefore, it seems that for a wing of any particular size and shape, the designer can estimate the lift by mapping the streamlines. As we’ll see later, from the streamline equations, it’s possible to derive the velocity of the air flow at any point in the flow field, and the circulation around the wing cross-section. Finally, one can work out the total lift from equation 1. In practice, it’s a laborious process, and it’s not sufficient, because the designer needs to know a lot more, for example, how the load is distributed across the wing surface, and where the centre of pressure lies. Let’s look at an example: a flat plate, the simplest conceivable profile for an aircraft wing. Without going into detail, we’ll give the results as they appear in [2], using a slightly different notation. In what follows, the term chord denotes the straight line between the leading and trailing edge. At a distance \(x\) measured aft from the leading edge along the chord, the normal pressure acting on the upper surface is
(4)
\[\begin{equation} p_{{\rm upper}} \left(x\right)\; =\; p\left(x_{c} \right)\; -\; \tfrac{1}{2} \rho V^{2} \left[\left(\frac{x_{c} -x}{x} \right)\sin ^{2} \alpha \; +\; 2\left(\frac{x_{c} -x}{x} \right)^{\tfrac{1}{2} } \sin \alpha \cos \alpha \right] \end{equation}\]where \(x_{c}\) is the chord length from leading to trailing edge, \(p(x_{c})\) is the atmospheric pressure at the trailing edge, \(\rho\) is the air density, \(V\) the aircraft speed, and \(\alpha\) the angle of attack. The expression for the pressure on the lower surface is the same except that a minus sign replaces the plus sign in the square brackets. The difference \(\Delta{p}(x)\) between the two at any location \(x\) is given by
(5)
\[\begin{equation} \Delta p\left(x\right)\; =\; 2\rho V^{2} \left(\frac{x_{c} -x}{x} \right)^{\tfrac{1}{2} } \sin \alpha \cos \alpha \end{equation}\]Figure 10
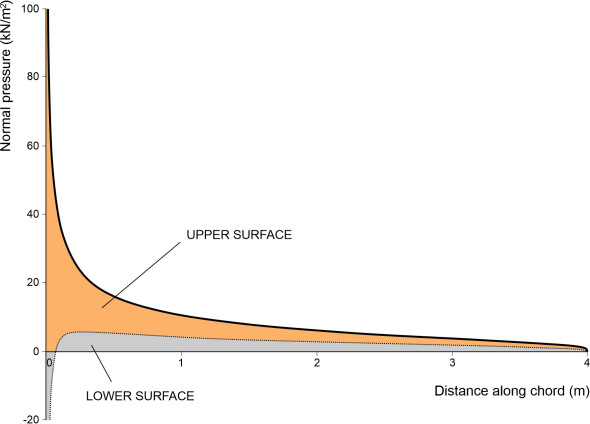
The graph in figure 10 shows how the upper and lower normal pressures vary along the chord of a particular flat plate ‘wing’. In this example, the chord is 4 m, the plate is inclined at an angle of 15\({^\circ}\) to the undisturbed flow, and the aircraft is travelling at a speed of 100 m s\({}^{-1}\). We’ll take the air density as 1.225 kg m\({}^{-3}\). The graph tells us two things. First, the greater proportion of lift arises from the reduced pressure on the upper surface, and second, it is concentrated near the leading edge.
In addition, one can derive a formula for the lift per unit length of wing. In this case, it’s not just a question of integrating the normal pressures round the aerofoil surface, because in the case of a flat plate there is a singularity at the leading edge that we have not taken into account here. We’ll just give the result:
(6)
\[\begin{equation} {\rm Lift\; per\; unit\; length\; of\; span}\; =\; \tfrac{1}{2} \rho V^{2} x_{c} \; \left(2\pi \sin \alpha \right) \end{equation}\]Assuming the lift is uniform at different points across the span, we can scale this up to yield the lift \(L\) for the whole wing:
(7)
\[\begin{equation} L\; =\; \tfrac{1}{2} \rho V^{2} \left(2sx_{c} \right)\; \left(2\pi \sin \alpha \right)\; =\; \tfrac{1}{2} \rho V^{2} A\; \left(2\pi \sin \alpha \right) \end{equation}\]where \(s\) is the wingspan and \(A\) the plan area. Now compare this with equation 10 in Section F1817, which is a general equation for the lift associated with a moving body:
(8)
\[\begin{equation} L\; =\; \tfrac{1}{2} \rho V^{2} AC_{L} \end{equation}\]We see that the expression \(2\pi sin\alpha\) on the right-hand side of equation 7 is equivalent to the coefficient of lift \(C_{L}\) for a flat plate. For small angles of attack, it’s value is approximately equal to \(2\pi \alpha\). It follows that the steeper the angle, the greater the lift. One can also show that the centre of lift lies well forward, at a distance \(x_{c} /4\) from the leading edge, a quarter of the way along the chord.
You might be wondering why go to all this detail for a flat plate, not a very realistic model for a real wing. It turns out, however, that many aerofoils having a thin, symmetric profile behave in a broadly similar way. Hence the flat plate is a useful introduction to the subject, and it helps to explain the aerodynamic behaviour of more realistic shapes. To make progress, we must now consider other factors: a real wing usually has a rounded nose so the velocity of the flow over the leading edge is finite. And it has a slightly arched profile that can significantly affect the lift. From this point onwards, we are dealing with more complicated geometric shapes.
Mapping the streamlines
So let’s turn to some more realistic aerofoil shapes using potential flow theory to determine the flow pattern. Bearing in mind that an ideal fluid is a greatly simplified representation of the air flowing over an aircraft wing, let’s map the streamlines anyway, and see where it gets us. But we’ll need to tighten up some basic definitions first, starting with the angle of attack \(\alpha\). It is easy to define \(\alpha\) for a flat plate, but less so for an aerofoil with curved surfaces. We need a reference line through the cross-section, which is usually taken to be the chord line, the straight line joining the leading edge and the trailing edge. Then the angle of attack is the angle between the direction of motion of the free stream and the chord line (figure 8).
To keep things simple, as before we’ll confine our attention to a short length of wing, treating the motion of the air as a two-dimensional flow field parallel to the aircraft’s central plane of symmetry. The forces acting on this wing element are shown in figure 11.
Figure 11
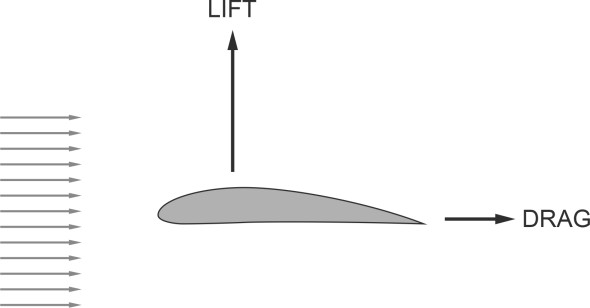
There are two components within the plane of the flow field: we’ve already met the lift force \(L\), which is directed at right-angles to the free stream velocity. The second is the drag force \(D\), which lies parallel to the free stream velocity and in the same direction.
The mathematical toolkit
You’ll recall that the motion of an ideal fluid follows certain rules that we hinted at earlier - they are covered in more detail in Section F1919. For much of the time, the air around us does indeed behave like an ideal fluid and obeys these rules. Imagine you are sitting in a room facing the window, and in your mind’s eye, choose a small parcel of air somewhere in front of you, about the size of a golf ball. If you reach out and cup your hands around the ball, you can change its shape. For example, you can mould it into a disc, and bend the disc back and forth. As long as you don’t try to squeeze the air into a smaller volume (or expand it into a larger one) it won’t resist. And, if you stand up and turn away from the window, the air won’t turn around with you, but like the needle of a compass, it will tend to preserve its orientation, rotating gently inside your hands.
In summary, the motion of an ideal fluid is driven by one simple requirement: continuity, in the sense that while it doesn’t resist deformation, what goes into any given region of space must come out. This greatly simplifies the problem. Neither forces nor pressures play a part in the calculations – their values emerge from the flow pattern itself. During the nineteenth century, mathematicians were able to show that a two-dimensional flow pattern can be represented by a network of equipotentials and streamlines. The equipotentials map a quantity called the velocitypotential. They are contours whose spacing indicates the local velocity of the fluid parcels that cross them. Closely packed equipotentials signify a steep ‘slope’ and high velocity at right-angles to the contours. The streamlines map the stream function. They indicate the direction of flow, and again, their spacing reflects the local velocity of the flow: they are packed together more tightly in regions where the fluid is moving fast.
Potential flows of this kind have two distinctive properties that enable you to work out from first principles the geometry of the streamlines, so you can plot them on a piece of paper or a computer screen, and determine the pressure that the fluid exerts on its surrroundings. They are:
(i) except at stagnation points, the equipotentials and streamlines intersect everywhere at right-angles, and
(ii) the stream function and the velocity potential are linear in the sense that the values for different potential flows can be added together to represent more complicated scenarios, such as the the flow through a pipe, or round an obstacle of some kind.
Potential flow patterns
You may already have encountered some examples of potential flows in Section F1919. The simplest is reproduced here in figure 12. It represents a uniform flow in parallel straight lines, like the atmosphere as it moves smoothly and steadily towards an aircraft.
Figure 12
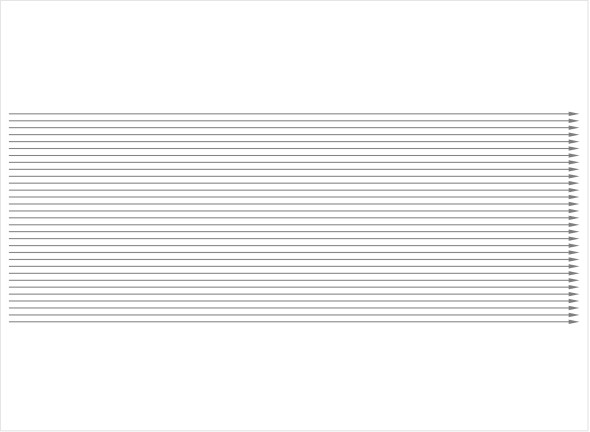
But for the moment, we’ll are going to experiment with some more complex flow patterns. Technical details of each pattern are given in the Appendix to this Section.
The first is a point source of the kind shown in figure 13.
Figure 13
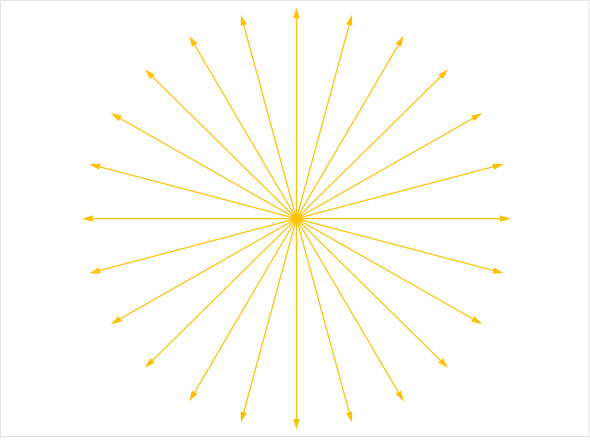
Think of it as a hole in the centre of your computer screen, from which fluid parcels are radiating outwards in all directions. Somewhat artificially, it is pumping air into the atmosphere, and we’ll need to remove it at the same rate, by adding a point sink nearby in which the direction of flow is reversed (figure 14).
Figure 14

This gives us the combined source and sink configuration that appears in figure 18.
Figure 15
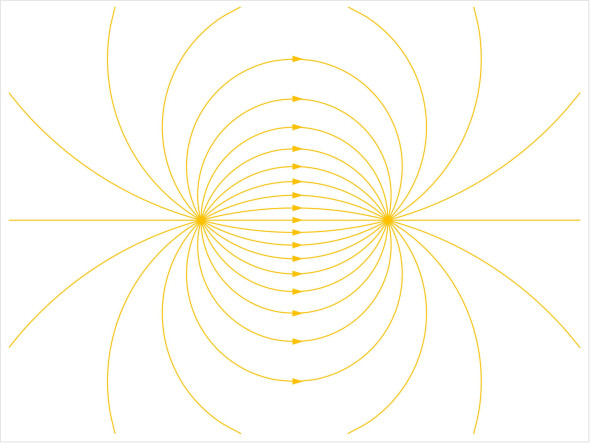
Now we bring the source and sink closer together – if we take the process to its logical conclusion the two flows will cancel each other out and disappear, leaving an empty flow field behind, so the trick is the increase both the rate of inflow and the rate of outflow in inverse proportion to the distance between them. In the limit, mathematically speaking, this yields the doublet flow pattern shown in figure 16.
Figure 16
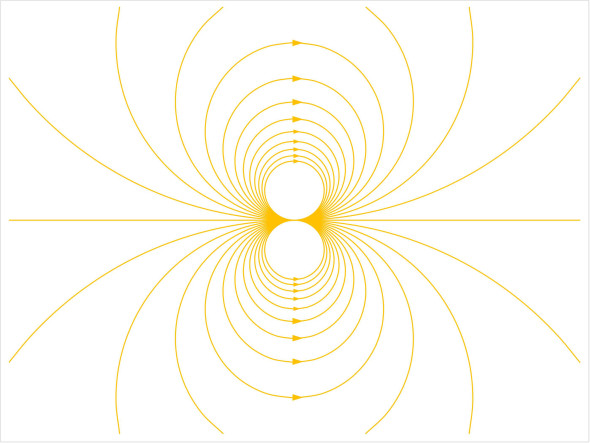
Now we insert the doublet pattern into the uniform flow mentioned earlier. The result is shown in figure 17, where the doublet streamlines are high-lighted in orange.
Figure 17
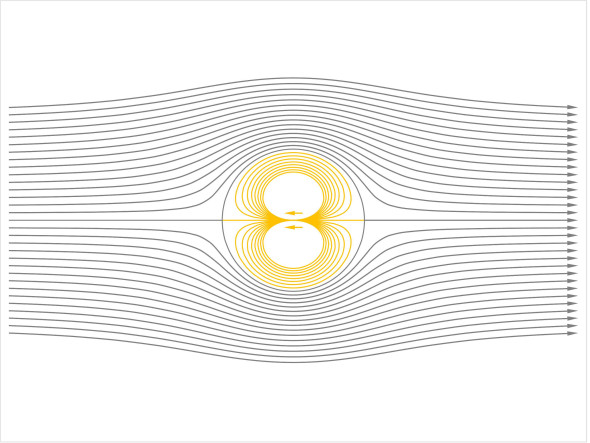
The oncoming flow squeezes the doublet into a distinct region of the flow field, whose boundary is a perfect circle. We can interpret this circle as the cross-section of a cylinder placed in the uniform air flow, and ignore the streamlines inside. It doesn’t look at all like an aircraft wing and since the flow pattern is symmetrical it is not producing any lift, but as we’ll see later, the cylinder can be adapted to model more complicated shapes.
The rotating cylinder
The next step is to add yet another potential flow pattern – a free vortex as shown in figure 21. You’ll find details of this flow pattern in Section F1818; essentially, the fluid particles travel in concentric circles, at speeds that are inversely proportional to the circle radius, so they’re moving fast near the centre but are almost stationary in distant parts of the flow field.
Figure 18

If we combine the pattern with the one shown in figure 17, we see that the fluid in contact with the outer surface of the cylinder is behaving as if the cylinder itself were revolving and dragging the air around with it (figure 19).
Figure 19

The air parcels don’t travel all the way round: they just move a little further and a little faster over the top than over the bottom, rather like an aircraft wing. Our cylinder is producing lift. It’s doing so because Bernoulli’s theorem applies here: the pressure on the upper surface falls and the cylinder experiences an upward thrust as it travels forward through the atmosphere.
We can estimate the lift by using equation 1. Let’s assume that the vortex has a circulation \(\Gamma\) equal to -250 m\({}^{2}\) s\({}^{-1}\), and that the density \(\rho\) of air is the same as the density at sea level under standard atmospheric conditions, 1.225 kg m\({}^{-3}\). Finally, if the velocity \(V\) is 100 m s\({}^{-1}\), the lift per metre of cylinder comes out as -(-250 \(\mathrm{\times}\) 1.225 \(\mathrm{\times}\) 100) or 30 000 N approximately, equivalent to around 3 tonnes per metre length of cylinder (as would be typical, in fact, of a 1930’s cargo aircraft of medium size). And in principle we could go further: starting with the stream function, we could derive a formula for the flow velocity at different points around the cylinder circumference, and by applying Bernoulli’s theorem, work out the value of the pressure at each point.
Aerofoils
But we really want to extend the procedure to the streamlined shapes used for aerofoils with a rounded nose and a pointed trailing edge. Before the arrival of computational fluid dynamics (CFD), the pioneers of aerodynamics research did this, not by analysing new shapes from scratch, but by stretching and squeezing the solution for the cylinder mathematically. In this sense, the circular cylinder can be used as a ‘proto-wing’. It doesn’t look much like a wing, but the cross-section can be adapted to different configurations such as an ellipse of the kind shown earlier in figure 6. The trick is to transform not just the wing profile, but all the streamlines in the flow field, in such a way as to preserve the special properties of a potential flow.
Transforming the cylinder into a wing
The transformation was achieved during the early 20\({}^{th}\) century by the Russian mathematician Nikolai Egorovich Joukowski (1847-1921) using a technique known as conformal mapping [16]. The technique can also be used to model phenomena such as magnetic fields, or the flow of heat in metal bar. All such processes have something in common: they take place in a continuous medium. What’s important in aerodynamics is not the flow as such, but how the fluid is affected by an obstruction, or by boundaries that channel the flow and constrict its motion. Often, the objects or the boundaries have complicated shapes that can’t be modelled directly, so we start with a simple shape and see if we can somehow transform it into the one we want. In its most general form, the boundary can be written as an equation in Cartesian coordinates:
(9)
\[\begin{equation} f\left(x,y\right)\; =\; 0 \end{equation}\]Analysts picture the variables \(x\) and \(y\) as the real and imaginary parts of a complex number \(z\), thus:
(10)
\[\begin{equation} z\; =\; x\; +\; iy \end{equation}\]all of which inhabit what is called the ‘\(z\)-plane’. Here, we’re interested in an ‘object’ (the aircraft wing) immersed in a steadily flowing stream of air, and we’ll take the initial curve \(f\left(x,y\right)\) to be a circle of radius \(a\). The centre doesn’t necessarily lie at the origin, as we’ll see in a moment. Next, we transform the circle into an aerofoil shape defined in terms of new coordinates \(X\) and \(Y\):
(11)
\[\begin{equation} F\left(X,Y\right)\; =\; 0 \end{equation}\]The coordinates \(X\) and \(Y\) are treated as the real and imaginary parts of a complex variable \(Z\):
(12)
\[\begin{equation} Z\; =\; X\; +\; iY \end{equation}\]and the aerofoil is plotted on the ‘\(Z\)-plane’. The change in shape will clearly affect the air flow close to the body surface, but it shouldn’t affect more distant parts of the flow field, so for large \(z\), we want \(Z\) to converge on the value of \(z\) itself. A possible formula that meets our requirements is
(13)
\[\begin{equation} Z\; =\; z\; +\; \frac{c_{1} }{z} +\; \frac{c_{2} }{z^{2} } +... \end{equation}\]and in fact, this is a generalised form of the Joukowski transformation [12]. You can see that in more distant parts of the flow field where \(z\) is large, on the right-hand side of the equation, the second and subsequent terms shrink to zero. This means that in the limit, \(z\) becomes identical to \(Z\), so the transformed flow field has the same streamline pattern as the original.
Joukowski profiles
The simplest form of the Joukowski transformation includes only the first two terms on the right-hand side, thus:
(14)
\[\begin{equation} Z\; =\; z\; +\; \frac{c^{2} }{z} \end{equation}\]where \(c\) is a fixed parameter whose value lies in the range 0 to 1. Imagine we start with a circle of radius \(a\) in the \(x,y\) plane, with its centre located at \(x_{0} ,y_{0}\). Its equation takes the form:
(15)
\[\begin{equation} \left(x-x_{0} \right)^{2} +\left(y-y_{0} \right)^{2} \; =\; a^{2} \end{equation}\]Then, for any coordinate pair (\(x,y\)) on this circle, the coordinates for the transformed profile in the \(X,Y\) plane are given by
(16)
\[\begin{equation} \begin{array} {l} {X\; =\; x\left[1+\frac{c^{2} }{\left(x^{2} +y^{2} \right)} \right]} \\ {Y\; =\; y\left[1-\frac{c^{2} }{\left(x^{2} +y^{2} \right)} \right]} \end{array} \end{equation}\]This transformation makes some interesting shapes including the flat plate, a curved plane, and an ellipse (all shown in figure 20; they emerge with the angle of attack \(\alpha\) set to zero, but this can be adjusted later, as required).
Figure 20
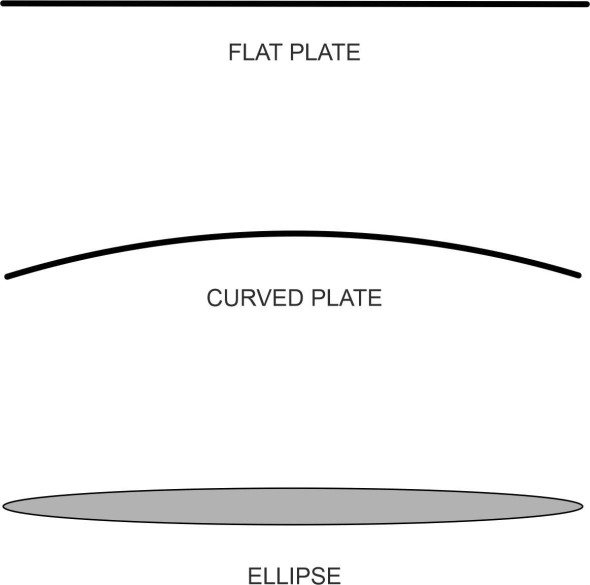
If we replace equation 14 by the equation for a streamline round a circular cylinder, equation 15 becomes the equation for the corresponding streamline around the aerofoil. Using this technique, Joukowski synthesised the flow field for more realistic aerofoil shapes in which the aft part was squeezed into a cusp, resulting in a symmetrical cross-section with a sharply pointed tail as shown in figure 21, and a ‘cambered’ version with a curved centreline, also shown in the Figure.
Figure 21
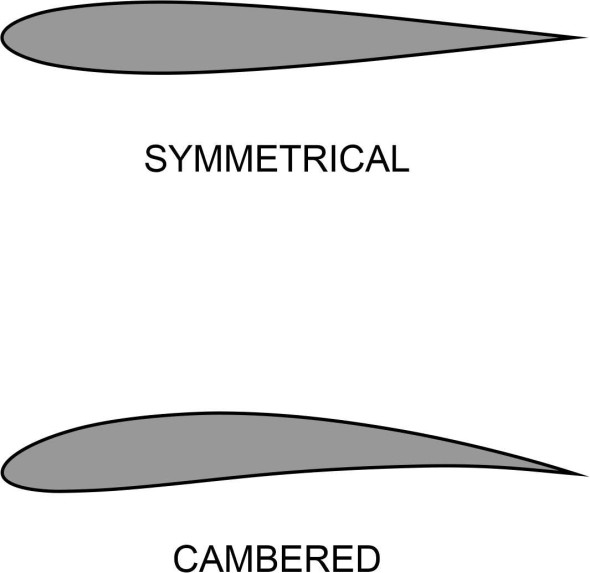
A useful outline of this technique appears in [1]. It’s the method used to produce many of the images of the flow field that appear in this Section. In each case, the circulation was created by adding a free vortex whose centre was located inside the aerofoil profile [4] [15], and its strength was carefully adjusted so that the streamlines made a smooth exit at the trailing edge.
Thin aerofoil theory
Kutta and Joukoswki were the first to model the flow around a realistic aerofoil, and theirs was the only analytical solution for a cambered profile until 1931 [5]. However, conformal mapping can only reproduce a particular family of aerofoil shapes, and different profiles were needed for the new generation of aircraft that appeared during the inter-war period [20]. During this period, a very gifted investigator, Ludwig Prandtl (1875 - 1953) together with his research students was breaking new ground in the field of aerodynamics. They were based in Göttingen, Germany. One of his students, Max Munk, found a way forward by picturing the aerofoil in a different way.
The behaviour of a thin wing is not very sensitive to the shape of its cross-section. Provided the ratio of thickness-to-chord is less than 12%, say, it is the overall curvature - in other words, the camber – that plays the greater part in generating lift, while variations in thickness have less influence. In effect, the wing can be defined in terms of its mean camber line, the line between the nose and the trailing edge that marks out the middle of the cross-section as shown in figure 22.
Figure 22

In order to estimate the lift, Munk replaced the aerofoil with a vortex sheet laid out along the camber line, and in what follows you’ll see that the shape of the wing surface plays no part.
You may have come across the concept of a vortex sheet earlier in Section F1917. It is a useful concept that turns up in different guises in engineering science, but it’s an elusive one. Imagine a row of line vortices arrange at right-angles to the direction of motion, with their centres spaced out at equal intervals along the camber line as shown in figure 23.
Figure 23

Individually, they are weak. Each has infinitesimally small circulation, they are spaced an infinitesimally small distance apart in the form of a continuous sheet. The result is a ‘continuum of vorticity’ whose local strength \(\gamma\) varies along the camber line. However, we can treat the vortices located within any small segment \(ds\) of the camber line as a single vortex that develops a circulation \(\gamma ds\), and when placed in a uniform air flow, each segment will affect the surrounding flow field to an extent that can be determined using potential flow theory. Now, since the fluid velocity in a vortex diminishes rapidly with increasing radius, the effect is most pronounced close to the camber line. In addition, since the vortices are all rotating in the same direction, the air will move faster over the upper surface than it does under the lower surface: the combined circulation generates lift.
The problem is that determine the overall lift, we must first work out how \(\gamma\) varies along the camber line. Two conditions must be met: first, the camber line must form a streamline of the flow, and second, the streamlines must fulfil the Kutta condition at the trailing edge. One can then find the overall circulation by integrating \(\gamma\) across the vortex sheet, and thereby determine the total lift together with other aspects of the wing’s aerodynamic behaviour. We haven’t gone into detail here because the theory is used less often today, but you can find more in [20] and [11].
More general aerofoil shapes
During the 1950s and the 1960s, the development of mainframe computers brought about another change of direction. The problem was how to handle thicker wings. Following pioneering work in the USA, designers began to use boundary element methods in which the wing surface itself rather than the camber line provides a scaffolding for the vortex sheet, which is now wrapped around the aerofoil as shown in figure 24. Using this approach, it’s possible to analyse an aerofoil of any arbitrary shape [11] [19].
Figure 24
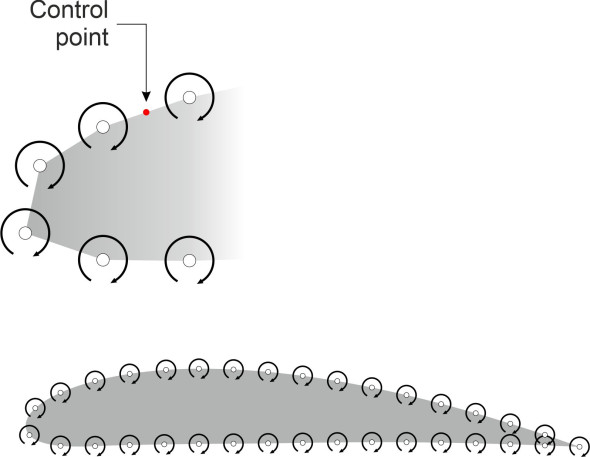
Mathematically, the vortex sheet is handled in a different way from the one mentioned earlier in connection with thin aerofoil theory. Here, we use numbers – physical measurements – to represent the aerofoil surface. This means breaking the surface down into \(n\) discrete strips known as panels, and treating each as a small but finite element in the flow pattern. On each panel we place a segment of vortex sheet with a particular strength \(\gamma\) that varies from one panel to the next. In the centre of each panel is a ‘control point’. To solve the problem, we must determine the value of \(\gamma\) in each panel so that when the effects of all the panels are combined, the resulting flow pattern satisfies the key boundary condition: at each control point, the velocity component perpendicular to the panel must be zero. However, there is an additional condition, the Kutta condition, which requires the streamlines to exit smoothly at the trailing edge. We now have more equations than unknowns, and one of the control point constraints must be omitted. We are left with a set of \(n\) equations for the \(\gamma _{i} ,i={\rm \; }1,{\rm \; }2,{\rm \; }\ldots ,n\), which can be solved numerically on a digital computer. The velocities and surface pressures follow.
Conclusion
In this Section we have tried to understand how an aerofoil creates lift. We’ve also looked at some of the mathematics that enabled the early pioneers to estimate the forces involved, so they could build practical flying machines. They were exploring a new field, an unfamiliar landscape whose conceptual landmarks were not intuitively obvious or easy to grasp. Some of the most important were the stagnation points near the leading and trailing edge of each wing, the angle of attack, and the role of ‘circulation’. For the theory to work, the air had to be treated as a frictionless, incompressible fluid that cannot rotate – it speeds up when it moves round an obstruction, moving faster on the inside of the curve, where the pressure falls relative to the surrounding atmosphere.
In the next Section (A1816), we’ll encounter some aerofoil profiles that have been developed for commercial aircraft in recent decades. Most have been created using a different kind of mathematical tool: numerical analysis carried out on a digital computer. Nowadays, it’s the most efficient way to carry out the repetitive calculations needed to synthesise the flow pattern round an arbitrary shape. You’ll notice, however, that while this has swept the mathematical difficulties aside, the underlying theory has not changed. The main ingredients are still the uniform field, the vortex, the point source, and the doublet, all potential flows having a special property: they can be added together to build a model of a more complex system.
Appendix: The component potential flows
Each of the aerofoil cross-sections pictured in this Section refers to a 1-metre length of wing measured at right angles to the aircraft’s axis of symmetry. The streamlines show the direction in which the air is moving in a vertical plane parallel to the axis, and the gap between neighbouring streamlines indicates the speed at which it is moving – the narrower the gap, the higher the speed. Each streamline corresponds to a particular value \(\psi\) of the stream function, and the location of any point along the curve is defined by the coordinates \(x\) and \(y\) in the vertical (\(x,y\)) plane. Here, it is more convenient to work in polar coordinates (\(r,\theta\)), putting
(17)
\[\begin{equation} \begin{array} {l} {x\; =\; r\cos \theta } \\ {y\; =\; r\sin \theta } \end{array} \end{equation}\]The coordinates of successive points along the streamline can be worked out from first principles, yielding an expression for \(r\) in terms of \(\theta\), or alternatively an expression for \(\theta\) in terms of \(r\). Details of the equations are given in what follows. For all the plots shown, the velocity \(V\) of air in the undisturbed flow field is set to 100 m s\({}^{-1}\), and the increment in the value of \(\psi\) between each pair of neighbouring streamlines represents a flow of 10 m\({}^{3}\) s\({}^{-1}\) over a 1-metre length of wingspan.
UNIFORM FLOW FIELD
(18)
\[\begin{equation} \psi _{{\rm uniform}} \; =\; Vr\sin \theta \end{equation}\]The streamline pattern is shown in figure 12.
POINT SOURCE
(19)
\[\begin{equation} \psi _{{\rm source}} \; =\; \frac{q\theta }{2\pi } \end{equation}\]where \(q\) is the overall rate at which fluid emerges from the source. In figure 13, its value is set arbitrarily to 240 m\({}^{3}\) s\({}^{-1}\).
SINK
(20)
\[\begin{equation} \psi _{{\rm sink}} \; =\; -\frac{q\theta }{2\pi } \end{equation}\]See figure 14. The details are as for the Point source streamlines except that the direction of flow is reversed.
COMBINED SOURCE AND SINK
The source and the sink are located respectively at (\(-S,{\rm \; }0\)) and (\(S,{\rm \; }0\)) on the \(x\)-axis, spaced a distance \(2S\) apart. When the two stream functions are added together, after some manipulation this leads to
(21)
\[\begin{equation} \psi _{{\rm source\; +\; }{\rm sink}} \; =\; \psi _{{\rm source}} \; +\; \psi _{{\rm sink}} \; =\; -\frac{q}{2\pi } \arcsin \left(\frac{2rS\sin \theta }{r^{2} +S^{2} } \right) \end{equation}\]The streamlines are plotted in figure 15, where the value of \(q\) is 240 m\({}^{3}\) s\({}^{-1}\), the same as the value used for the individual source and sink plots. The half-spacing \(S\) is set to an arbitrary value a little over 1 m.
DOUBLET
The stream function for the doublet is obtained as a special case of the combined source and sink, in which the half-spacing \(S\) is reduced while the strength \(q\) of the source is increased, in such a way that their product remains constant, in other words, \(qS=k\). When the separation vanishes, the source and sink fuse together as shown in figure 16. Here, we choose the value of the constant \(k\) such that, when immersed in the uniform flow field mentioned earlier, the doublet is contained within a circular streamline of radius \(a\), simulating the outline of a cylinder. To meet this condition, we put \(k\; =\; \pi a^{2} V\). Hence \(q\; =\; \pi a^{2} V/S\), and substituting in equation 20 we have:
(22)
\[\begin{equation} \psi _{{\rm source\; +\; }{\rm sink}} \; =\; -\frac{a^{2} V}{2S} \arcsin \left(\frac{2rS\sin \theta }{r^{2} +S^{2} } \right) \end{equation}\]Then
(23)
\[\begin{equation} \psi _{{\rm doublet}} \; =\; {\mathop{\lim }\limits_{S\to 0}} \left(\psi _{{\rm source\; +\; sink}} \right)\; =\; -\, \; \frac{a^{2} V\sin \theta }{r} \end{equation}\]CYLINDER WITH ZERO CIRCULATION
Now we combine the doublet with the uniform flow field to get the flow pattern over a cylindrical ‘wing’ of radius \(a\) as shown in figure 17:
(24)
\[\begin{equation} \psi _{{\rm cylinder}} \; =\; \psi _{{\rm uniform}} \; +\; \psi _{{\rm doublet}} \; =\; \tfrac{V}{r} \left(r^{2} -a^{2} \right)\sin \theta \end{equation}\]VORTEX
The stream function for a free vortex centred on the origin at \(r={\rm \; }0\) is
(25)
\[\begin{equation} \psi _{{\rm vortex}} \; =\; -\frac{\Gamma }{2\pi } \ln \left(\tfrac{r}{a} \right) \end{equation}\]The vortex flow pattern appears in figure 18, where the circulation parameter \(\Gamma\) is set arbitrarily to a value of -250 m\({}^{2}\) s\({}^{-1}\).
CYLINDER WITH CLOCKWISE CIRCULATION
Finally, we combine the vortex with the cylinder flow pattern to obtain a modified pattern of flow round a cylinder with added circulation:
(26)
\[\begin{equation} \psi _{{\rm cyl\; with\; circulation}} \; =\; \psi _{{\rm cyl}} \; +\; \psi _{{\rm vortex}} \; =\; \tfrac{V}{r} \left(r^{2} -a^{2} \right)\sin \theta \; -\; \tfrac{\Gamma}{2\pi} \ln \left(\tfrac{r}{a} \right) \end{equation}\]The result appears in figure 19.