A.1810
The three-dimensional wing
‘…the veil covering the secrets of… the dynamic interactions of fluids and solid objects has only begun to be lifted… and continues to refuse all efforts to tear it cleanly away’
Engineers and scientists solve problems by breaking them down into smaller ones and tackling them one by one. It’s a ‘reductive method’ that helps them to make sense of a complicated world. Explaining how an aircraft flies is a good example. Up to this point in our web site, we’ve pictured the wing as a kind of plank, a plank of uniform cross-section that is placed at right-angles to the oncoming air flow. If we notionally divide the wing into parallel slices as shown in figure 1, we can extract a typical slice, analyse its behaviour in a wind tunnel, and scale up the results to the whole wing.
Figure 1
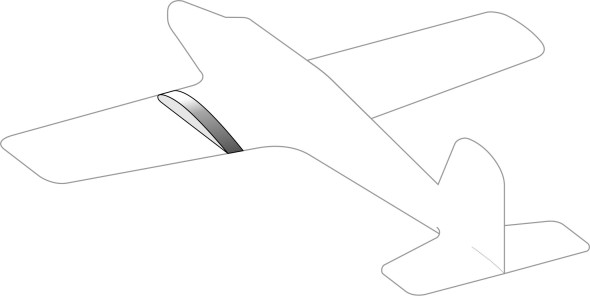
This assumes that each part of the wing behaves in the same way, but in reality it doesn’t, and we must now start thinking about the air flow around the wing as a more complicated pattern of movement in three-dimensional space. There are many variables to consider, and to keep track of them, you may want to refer to the Glossary at the end.
Wing geometry
In this Section, we’ll focus on straight wings of the kind found on slow-moving aircraft. By ‘straight’ we mean wings that are fixed approximately at right-angles to the aircraft fuselage. We’ll start with the geometry, and run through some of the parameters that define the shape of the wing surface and influence its aerodynamic behaviour.
Frame of reference
First, we need a fixed frame of reference – a coordinate system against which the parameters can be measured. Mostly on this web site, we’ve pictured vehicles moving from left to right, in the direction of what would normally be the \(x\) axis on a graph. Here, as shown at the top of figure 2, we’ll use a different orientation, because for the time being we are interested not in the movement of the aircraft itself, but the movement of the air travelling over the wings.
Figure 2
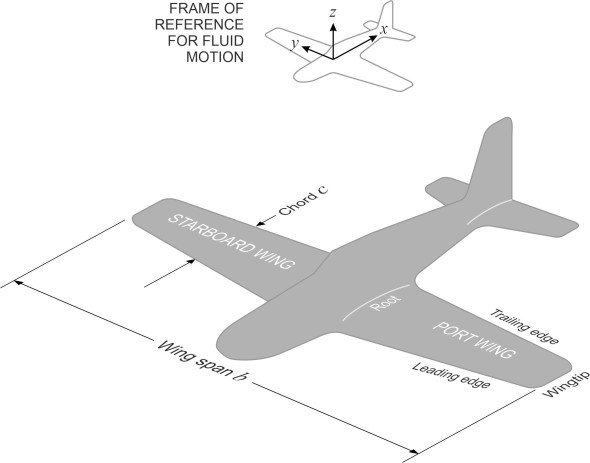
So the \(x\) axis marks the direction of the undisturbed air stream, the \(z\) axis indicates distance vertically upwards, and the \(y\) axis transverse distance, positive to starboard.
figure 2 also shows different parts of the aircraft wing. Not shown are the details of the cross-section. It is rarely uniform; typically, the wings are tapered in plan, with the chord and thickness diminishing towards the wingtips. Also, when viewed from the front, the wings are fixed at an angle to fuselage, canted upwards slightly (or occasionally, downwards). It is called the dihedral angle, and it has nothing to do with lift or drag. It’s concerned with stability, a different phenomenon altogether that we’ll be looking at later in Section A0418.
Plan form
During the early years of aviation, many aircraft had two sets of wings, one mounted above the other, and approximately rectangular in plan. They were known as biplanes. The advantage of the biplane layout was that it made the wings more rigid: connected with struts and wires, they worked in tandem like a bridge truss (figure 3).
Figure 3
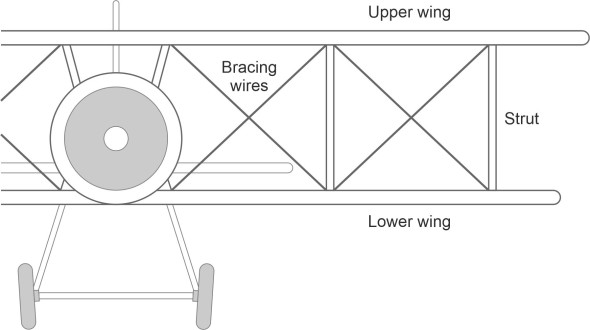
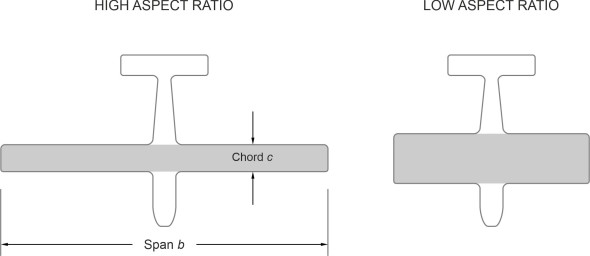
In the days when aircraft were built with wood and canvas, this arrangement was stronger than a single wing cantilevered out from the fuselage. However, the struts and wires added significantly to the air resistance, and with modern materials it is possible to make a single wing of comparable lifting power, that is strong, light in weight, and generates less aerodynamic interference. The span must be larger, so monoplanes tend to have longer and narrower wings with a larger ratio of span \(b\) to chord \(c\) (figure 4). This ratio is known as the aspect ratio, denoted by \({\rm AR}\) for short. For a light aircraft, its value typically will lie between 7 and 10.
Figure 4
You’ll be familiar with two other wing layouts: the swept wing and the delta plan form. The wings of most jet airliners today are aligned not at right-angles to the fuselage but ‘swept’ rearwards at an angle as shown in figure 5.
Figure 5
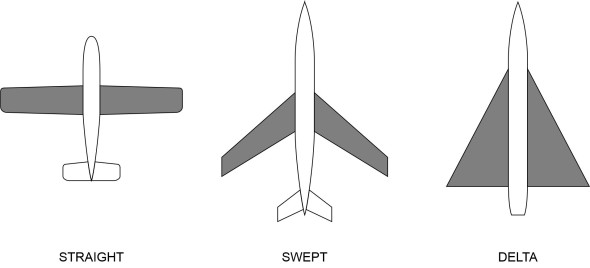
A swept wing behaves much like a conventional ‘straight’ wing, but there are important differences that we’ll take up later in Section A1410. Also shown in figure 5 is the delta wing, which has a roughly triangular planform. It is sometimes used for high-speed military aircraft, and was adopted for the Boeing Space Shuttle and the Concorde supersonic airliner, but since the Concorde fleet was retired in 2003, delta wings are rarely seen today. The aerodynamic behaviour of the delta wing is very different from the behaviour of a conventional wing, and we’ll return to it later in Section A1410, together with more exotic configurations such as the ‘lifting body’ concept, different versions of which were tested by NASA as possible space mission recovery vehicles. Here, however, we’ll remain with ‘straight’ wings.
Variations in wing geometry across the span
Most wings are tapered in plan, so the chord varies between the wing root and the wingtip. This is structurally efficient. It concentrates material near the root where the bending moment is greatest, which results in a stiffer structure with less likelihood of unwanted deformation under load, or to put it the other way round, it enables the designer to minimise the overall weight of the wing. For a tapered wing, the ‘average’ chord can be taken as the plan area \(A\) divided by the span \(b\), so the aspect ratio is equal to \(b\) divided by (\(A/b\)), or \(b^{2} /A\).
In principle, while the chord might vary, the cross-section can have the same shape at each location, appropriately scaled up or down in size. However, in many cases the profile varies from one part of the wing to another so that, for example, the thickness-to-chord ratio can differ between the root and wingtip. Also, the slope of the chord line may vary, with the angle of attack diminishing steadily towards the wingtips. A feature sometimes referred to as washout, this reduces the risk of premature stall beginning at the wingtip, which as we’ll see later, is one of the reasons why early aviators sometimes lost control of their machines, with fatal results.
The 3D flow pattern
We can now turn to the air flow over the surface of our three-dimensional wing. If we could divide it into longitudinal slices as shown earlier in figure 1, and treat each slice as a two-dimensional aerofoil, we could estimate the lift it generates either from basic aerofoil theory, or measure it in a wind tunnel, and add the results together to determine the total for the wing. But a two-dimensional aerofoil is an idealised model that represents a slice of an infinitely long wing of uniform cross-section. By contrast, the flow over a three-dimensional wing is more complicated. In three dimensions, the flow patterns for different parts of the wing interact, and it’s not easy to adjust the results to take this into account. Here, we’ll try to sketch the theory and interpret the outcome in practical terms.
The bound vortex
Ultimately, the lift created by a wing arises from a simple fact: the parcels that travel over the top move faster than the ones travelling underneath. The difference in speed implies that in aerodynamic terms, they are circulating around the aerofoil cross-section. This doesn’t mean they are spinning round it like the spokes of a wheel: only that there is a vortex embedded in the flow field, and it’s the component responsible for creating lift. It is produced by the wing and wrapped round it like a bandage, and since it’s tied to the vehicle structure, we call it a bound vortex.
Figure 6
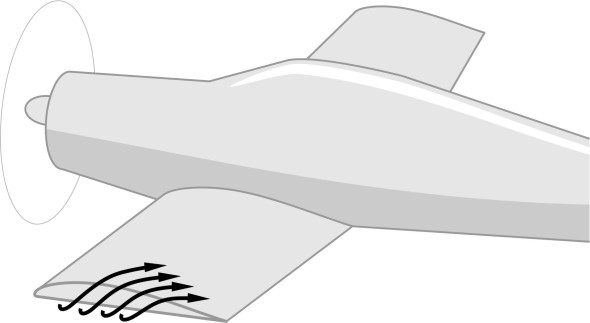
For a finite, three-dimensional wing, this immediately raises a question. Figure 6 shows the port wing. Since the pressure on the upper surface is less than the pressure on the lower surface, some of the air parcels ‘leak’ around the wingtip. Hence, there is lateral motion as well as motion in the fore-and-aft direction: above the wing surface, the parcels deviate a little inboard, while below the wing they deviate outboard (figure 7).
Figure 7
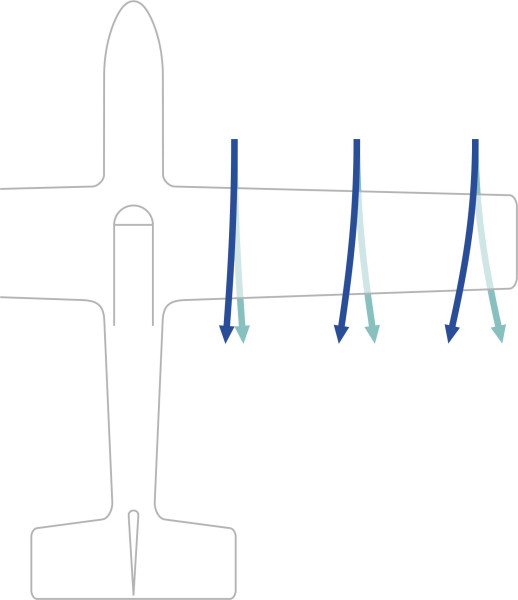
To some extent, the lateral movement acts as an escape route, relieving the pressure difference between the upper and lower wing surfaces. In effect, this weakens the bound vortex towards the wingtip, which tells us that our picture of the flow pattern is incomplete. According to classical flow theory, the circulation associated with a vortex has the same value at all points along its length, which means that it cannot weaken or terminate in mid-air. Hence the bound vortex must be part of a larger system.
The trailing vortices
A century ago, Frederick Lanchester, one of the great pioneers of aerodynamics, claimed that an aircraft was supported on two vortices. At the time, people didn’t understand what this meant, but with a little explanation, it makes sense. When we view the wing as a three-dimensional whole, we see the approaching stream of air travelling towards the wing at velocity \(V\). The air parcels are free to move in any direction, and predominantly, the wing pulls them downwards, so within the region of the wingspan, there is a net downward movement. The vertical velocity component is small compared with \(V\), and the resultant velocity vector is inclined just a few degrees below the horizontal. Since under normal conditions the density of the air remains constant, somewhere else within the flow field, air must be rising to take its place. Hence the downward movement is only the first stage in a process of displacement: the atmosphere rotates on a larger scale. This wider rotation produces two free vortices that trail from the wingtips. A cross-section of the aircraft wake appears in figure 8, as seen from behind.
Figure 8
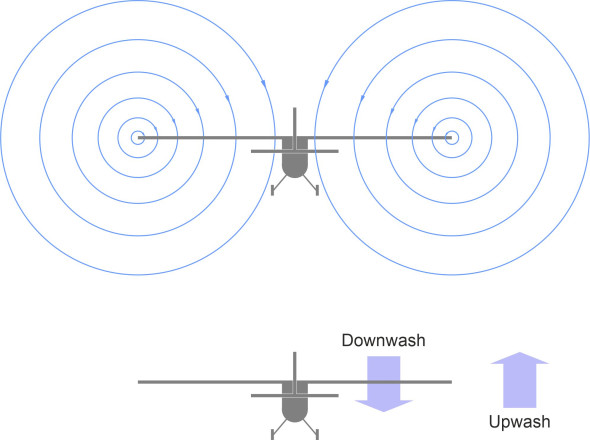
Let’s focus on the starboard vortex: it is centred on a point near the wingtip, and the air parcels are moving towards us in an anticlockwise spiral. At any given moment, those outboard of the wingtip are moving upwards, while those inboard are moving downwards. The upward movement is a secondary effect in the sense that the air parcels are rising to compensate for the downward motion induced by the wing. The two free vortices trail from the wingtips and are left behind in the aircraft wake, continuously growing in length during the course of a flight, and carrying energy away into the atmosphere.
The trailing vortices and the bound vortex are intimately connected: in fact, we can treat each trailing vortex as an extension of the bound vortex having the same strength [5]. In a simplified form, figure 9 shows how, together with the bound vortex, the trailing vortices form a U-shaped or ‘horseshoe’ system that extends behind the aircraft.
Figure 9
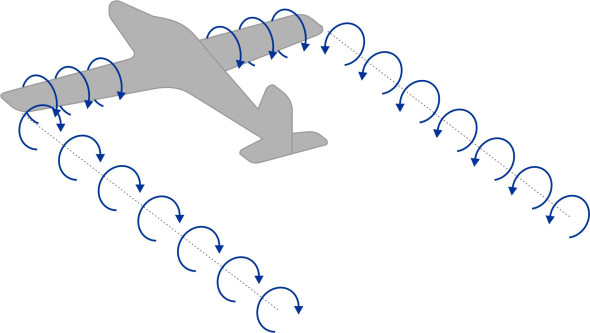
According to the classical model, a vortex cannot terminate in mid-air, so the trailing vortices must somehow be linked astern to form a complete loop. The link is known as the starting vortex. It forms very early during the flight, as soon as the aircraft starts to move along the runway, but is left behind after take-off, and soon dissipates in turbulence and friction, as do the rearmost parts of the trailing vortices themselves.
Although the trailing vortices themselves are not visible, almost anywhere in the sky today, one can see condensation trails left behind by passing aircraft. They consist of water vapour that turns into ice particles at high altitude. They are produced by the engines, and drawn into the trailing vortices, sometimes persisting for several kilometres before turning into an atmospheric haze. Since the two vortices rotate in opposite directions, they tend to drag each other down, and along with the condensation trail, sink slowly in the aircraft wake.
Downwash
Although it trails behind, the influence of each trailing vortex extends across the whole wing planform. Inboard of the wingtip, it produces what is widely known as downwash. As shown in the lower part of figure 10, it changes the direction of the flow field through which the wing is travelling, so the oncoming stream slopes downward at an angle \(\varepsilon\) from front to rear.
Figure 10
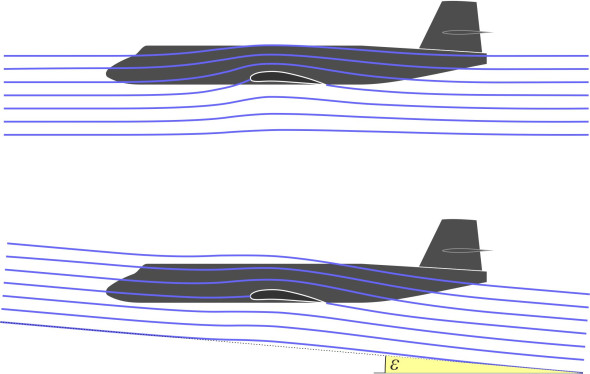
Consequently, it changes both the angle of attack and the lift generated locally by the aerofoil (figure 11).
Figure 11
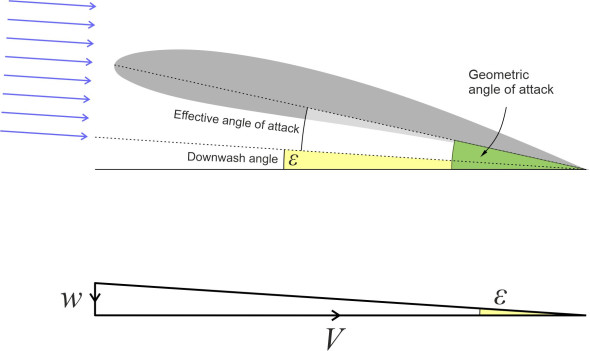
The deflection angle \(\varepsilon\) varies from place to place along the wingspan. This is because the air parcels in a vortex travel at different speeds depending on the radius of their orbit: in potential flow theory, those circulating close to the axis travel faster than those further away (figure 12).
Figure 12
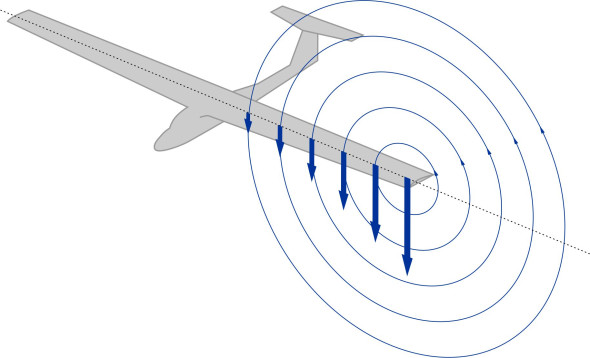
This in turn affects the distribution of lift – different parts of the wing contribute different amounts to the total. The horseshoe system is an idealised picture of the interaction between the wings and the surrounding atmosphere on a large physical scale. But there are aspects that our model doesn’t explain. In particular, according to classical flow theory, a vortex must have uniform strength throughout, whereas because of leakage, the circulation within the bound vortex falls to zero at the wingtip. How, then, can the bound vortex and the trailing vortices be part of the same system?
The lifting line
Working independently around the turn of the nineteenth century, two pioneering researchers resolved the problem by picturing the flow pattern in a different way. In the UK, Frederick Lanchester conceived the idea of a bundle of vortices attached to each wing (figure 13).
Figure 13
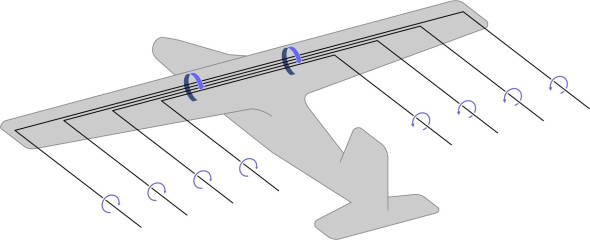
During the same period, Ludwig Prandtl in Germany was working on a similar concept and testing it in the laboratory. He referred to it as a lifting line. It’s usual to refer to the component vortices as called ‘filaments’. By definition, the circulation around each filament is constant throughout its length, so the new pattern obeys the rules of classical flow theory, but the individual filaments split off at different points, and when added together, the total strength of the circulation around the wing diminishes steadily from a maximum at the root to zero at the wing tips.
This is where the puzzle begins. We are trying to simulate the flow round a finite wing, and we need to know how many vortex filaments should be included in the bundle, and how should the characteristics of each filament be determined, in particular, its size and strength. The key lies in two quantities whose values vary with distance \(y\) along the wingspan. They are (a) the local circulation around the wing per unit length, which we’ll denote here by \(\gamma \left(y\right)\), and (b) the local downwash velocity component \(w\left(y\right)\) (figure 14).
Figure 14
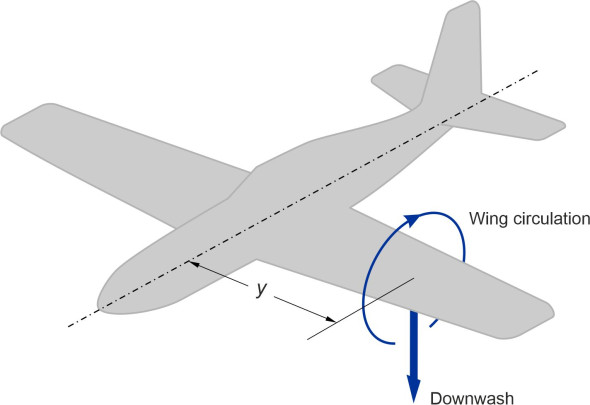
Prandtl’s aim was to configure the vortex filaments in such a way that the two distributions were consistent, a challenging task because (to put it simply) the circulation associated with any given filament \(i\) contributes to the downwash encountered by filament \(j\). This downwash determines the angle of attack and hence the circulation that filament \(j\) can generate, and in turn, the contribution that it makes to the downwash encountered by filament \(i\): it is a process of mutual interaction. Prandtl set up the problem in the form of an integral equation for the circulation profile across the span.
Figure 15
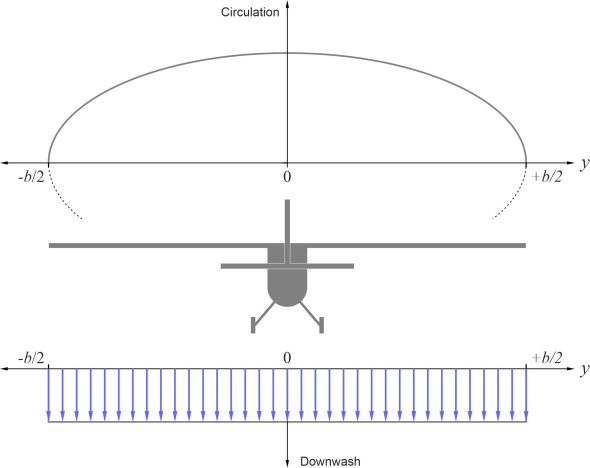
The equation was difficult to solve, until it was discovered that for the particular case where the circulation follows an ‘elliptical’ distribution as shown in figure 15, the downwash is uniform across the span – for a proof see [7]. It turns out that in practice, for many wings the circulation is indeed roughly elliptical, and assuming this is the case, for the purpose of preliminary design and development one can derive reasonable estimates of the lift distribution as a function of the wing geometry and aircraft speed. An elliptical profile not only simplifies the calculations, but generates the least possible induced drag, a pheomenon to which we’ll return later.
A different approach is needed for wings with a non-elliptical circulation profile. Eventually, Prandtl’s lifting line was developed into a vortex sheet in which the filaments were spread out across the chord as shown in figure 16, a concept that Prandtl called a lifting surface [6].
Figure 16

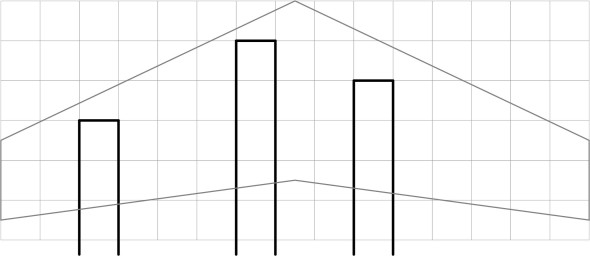
Widely used nowadays is a variant called the vortex lattice method, in which an incremental horseshoe vortex is attached to each of a number of points arranged in a rectangular grid as shown in figure 17. Using a digital computer, the strength of each vortex can be adjusted to simulate not only the pattern of circulation around the wing but, when supplemented with line sources and doublets as described earlier in Section A1816, it can reproduce the geometry of the surface itself, so that in principle it can predict the behaviour of a wing of any given shape and cross-section.
Figure 17
Aerodynamic forces
We’ve just outlined the approach used by aerodynamicists to predict the lift created by a real wing. To round off this Section, we’ll narrow the focus a little and consider an idealised wing having a constant cross-section and an elliptical lift distribution, using basic principles to derive some analytical expressions for lift and drag. Although the results don’t apply to all wings, they help to explain some important aspects of wing behaviour in general terms, and point to the most favourable proportions for generating lift.
Lift
Ultimately, the lift generated by any part of a wing depends on the intensity with which the air circulates around it. We’ll start with a long wing – an indefinitely long wing in fact – so the circulation \(\gamma\) per unit length and the lift \(l\) per unit length are constant throughout. Denote the atmospheric density by \(\rho\). The air flow is directed at right-angles to the leading edge at velocity \(V\). From the Kutta-Joukowsky theorem, we know that for each unit length
(1)
\[\begin{equation} l\; =\; \rho V\gamma \end{equation}\]Now suppose we shorten the wing to a specific length \(b\). We’ll denote the circulation at a distance \(y\) from midspan by \(\Gamma \left(y\right)\), and the lift by \(L\left(y\right)\). Both are measured per unit length of wing, and we assume that when plotted against \(y\), the graph of \(\Gamma \left(y\right)\) is elliptical:
(2)
\[\begin{equation} \Gamma \left(y\right)\; =\; \Gamma \left(0\right)\sqrt{1-4\left(\frac{y}{b} \right)^{2} } \end{equation}\]where \(\Gamma \left(0\right)\) is the circulation at midspan. The total circulation \(\Gamma\) is obtained by integrating \(\Gamma \left(y\right)\) over the range \(-b/2{\rm \; }\le \; y\; \le \; b/2\), which yields the result
(3)
\[\begin{equation} \Gamma \; =\; \frac{\pi }{4} b\Gamma \left(0\right) \end{equation}\]To get any further, we must find an expression for \(\Gamma \left(0\right)\) in terms of the wing geometry and aerofoil parameters. For simplicity, assume we are dealing with a thin aerofoil (we have already stipulated that the cross-section and angle of attack are uniform across the span). An approximate formula for \(\Gamma \left(0\right)\) in this case is derived in Appendix I:
(4)
\[\begin{equation} \Gamma \left(0\right)\; =\; \frac{\gamma }{\left(1+\frac{\pi }{2.{\rm AR}} \right)} \end{equation}\]Now, the right-hand side of this equation can be substituted for \(\Gamma \left(0\right)\) in equation 3 to yield:
(5)
\[\begin{equation} \Gamma \; =\; \frac{\pi b\gamma }{4\left(1+\frac{\pi }{2.{\rm AR}} \right)} \end{equation}\]From the Kutta-Joukowski theorem we know that the lift \(L\) is given by
(6)
\[\begin{equation} L\; =\; \rho V\Gamma \; =\; \frac{\pi \rho Vb\gamma }{4\left(1+\frac{\pi }{2.{\rm AR}} \right)} \end{equation}\]Hence the lift per unit span \(L/b\) works out as follows:
(7)
\[\begin{equation} \frac{L}{b} \; =\; \frac{\pi \rho V\gamma }{4\left(1+\frac{\pi }{2.{\rm AR}} \right)} \end{equation}\]We can compare the right hand side of this equation directly with the equivalent quantity \(\rho V\gamma\) for an infinitely long wing, which appears on the right-hand side of equation 1. Clearly, the finite wing produces less lift per unit length, and it’s not difficult to show that this is true at every point across the span. For example, if we insert the value 6 for the aspect ratio, we see the overall lift per unit span is equivalent to about 62% of that for the ‘long’ wing, a reduction of about 38%. It arises essentially from the lift lost around the wingtips - the outermost part of a real wing does less work than the centre section. The shorter the wing, the smaller the aspect ratio, and the greater the loss of lift.
Note that the above results don’t apply to an aircraft flying close to the ground. When the aircraft comes in to land, the runway surface gets in the way of the downwash, so the downwash angle falls. This causes the induced drag to fall and the angle of attack to rise. As a result, the lift increases and the aircraft ‘floats’ above the runway as if on a cushion. The phenomenon is known as the ground effect. It provides a margin of safety when an aircraft lands, because the support increases quite quickly during the last part of the descent. On take-off however, the opposite occurs: it diminishes rapidly when the aircraft leaves the ground, and extra thrust is needed for it to climb to a safe level.
The cost of lift
There are several distinct kinds of aerodynamic resistance or ‘drag’. We’ll review the different categories later in Section A1716, but for now, we’ll concentrate on just one. It arises from the process of generating lift. Earlier in this Section, we viewed the three-dimensional flow pattern for a finite wing in simplified form, as a single horseshoe. We’ve seen how the wing itself changes the direction of the free stream, inducing a downward component of velocity at each point along the wingspan, so that the air parcels arrive at a slight angle as shown earlier in figure 11. If at any given point we denote the downward velocity component by \(w\) and the angle by \(\varepsilon\), then
(8)
\[\begin{equation} \varepsilon \; =\; \arctan \left(\frac{w}{V} \right) \end{equation}\]where \(V\) is the aircraft velocity. If the air is angled slightly downward, the lift force pivots aft through a similar angle as shown in figure 18, and the lift itself now presents a component in the opposite direction to the direction of motion.
Figure 18
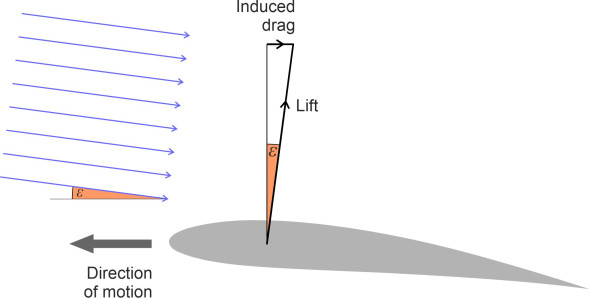
It’s a form of resistance peculiar to lifting bodies, and it has different names, such as ‘drag due to lift’, and ‘vortex drag’. We’ll use the old-fashioned one: induced drag. For a modern commercial aircraft, it accounts for a quarter of the total drag or more [3]; hence for every kilometre travelled, an aircraft expends a significant amount of energy just to keep it in the air.
Estimating the downwash \(w\) and thence the induced drag has been described as an ‘intricate and lengthy problem’ [10], except for the special case where the wing loading is elliptical, (or equivalently) the downwash is uniform along the wing span. Here, as Prandtl discovered, the induced drag coefficient \(C_{D,i}\) reduces to:
(9)
\[\begin{equation} C_{D,i} \; =\; \frac{C_{L} {}^{2} }{\pi .{\rm AR}} \end{equation}\]In the more general case where the wing loading is not elliptical, the induced drag coefficient is larger, and equation 9 becomes
(10)
\[\begin{equation} C_{D,i} \; =\; \frac{C_{L} {}^{2} }{\pi .{\rm AR.}e} \end{equation}\]where \(e\) is the span efficiency factor. In the special case where it is elliptically loaded, the wing is 100% efficient and we put \(e\; =1\), which takes us back to equation 9. For a non-elliptically loaded wing, the efficiency is less, so we put \(e\; <\; 1\) and the drag coefficient rises.
Together, equations equation 9 and equation 10 tell us that subject to the assumptions we’ve made, the induced drag coefficient is inversely proportional to the aspect ratio \({\rm AR}\); a long, narrow wing not only produces more lift, but also produces less induced drag. This is why aircraft such as passenger jets and strategic bombers that undertake long-distance flights have long, narrow wings. The same applies to sailplanes and albatrosses: all conserve energy by minimising the induced drag. However, there is a limit to what the engineer can do. When the load is spread over a long wingspan, it causes high bending stresses near the root, and the wing must be stiffened so it doesn’t distort in flight. By comparison, fighter jets have short, stubby wings that are aerodynamically less efficient, but they can sustain the forces that arise from violent manoeuvres in combat.
Mention of jet fighters raises an interesting question. Given a wing of any particular shape, how does the induced drag change with increasing speed? Its value can be expressed in the standard form
(11)
\[\begin{equation} D_{i} \; =\; \tfrac{1}{2} \rho V^{2} AC_{D,i} \end{equation}\]where \(A\) is the plan area of the wing. It looks as though \(D_{i}\) rises with increasing speed as one might expect. But the induced drag coefficient \(C_{D} {}_{,i}\) on the right-hand side is not a fixed quantity. Let’s rearrange the equation in a different form:
(12)
\[\begin{equation} C_{D,i} \; =\; \frac{2D_{i} }{\rho V^{2} A} \end{equation}\]Similarly, we can express the lift \(L\) in the standard form
(13)
\[\begin{equation} L\; =\; \tfrac{1}{2} \rho V^{2} AC_{L} \end{equation}\]which can be rearranged to obtain
(14)
\[\begin{equation} C_{L} \; =\; \frac{2L}{\rho V^{2} A} \end{equation}\]Substituting for \(C_{D} {}_{,i}\) and \(C_{L}\) in equation 11, we get
(15)
\[\begin{equation} D_{i} \; =\; \frac{2L^{2} }{\pi \rho V^{2} A{\rm .AR}} \end{equation}\]During horizontal flight, the lift \(L\) is effectively fixed: it must equal the aircraft’s weight. Since all the other quantities on the right-hand side are fixed except \(V\), we see that unlike other forms of drag, the induced drag falls as the aircraft speed rises.
Pitching moment
We’ve seen how the atmosphere supports an aircraft wing. The air parcels apply normal pressure and friction stresses to each part of its surface, and when added together, they produce a net force. We usually picture the force in terms of two components: an upward component that lifts the aircraft off the ground, and a drag component that resists forward movement. In addition, the stresses produce a pitching moment\(M\) that causes the wing to rotate. For example, if the upward pressure stresses are concentrated near the trailing edge, they will act as a lever, lifting the tail of the aircraft and tipping the nose down. The horizontal stress components may contribute to the rotation in a similar way, but since the lever arm is small, they have a comparatively weak effect.
In aeronautical design, it is the convention to calculate the pitching moment as the sum of the moments of all the aerodynamic forces acting at different places on the wing surface relative to a specified point P such as wing leading edge. A positive value indicates a tendency to pitch nose-up, while a negative value indicates pitching nose-down. The value of \(M\) varies with the location of P, and this complicates the analysis. However, there is a way to simplify matters. When an aircraft speeds up or slows down, the angle of attack will rise or fall and this in turn affects all the forces acting on the wing cross-section. However, it has been confirmed by experiment under different flight conditions that there is a point about which the pitching moment remains virtually unchanged [1]. It’s called the aerodynamic centre. Theoretically, for a thin wing in potential flow, the aerodynamic centre is located at a quarter of the distance along the chord from the leading edge, and this is often used as the reference point for pitching moment calculations.
In aircraft design, instead of working with the forces \(L\), \(D\) and \(M\), it is often convenient to express each force in terms of a dimensionless coefficient. We have already met the lift coefficient \(C_{L}\), which appears in the general formula for aerodynamic lift as set out earlier in equation 13. One can write down an equivalent formula for the pitching moment:
(16)
\[\begin{equation} M\; =\; \tfrac{1}{2} \rho V^{2} Ac\; C_{M} \end{equation}\]in which \(A\) denotes the plan area of the wing, \(c\) the chord, and \(C_{M}\) the dimensionless pitching moment coefficient. Since most wings are cambered and tend to pitch nose-down, its value is usually negative. It’s an important parameter in aircraft design, because a large pitching moment makes an aircraft difficult to fly. We’ll return to this topic later in Section A0418.
The aircraft wake
The air parcels that support an aircraft wing divide into two streams, the first passing over the top of the wing, and the second passing underneath. They come together behind the trailing edge, and where they meet, both streams are moving aft but not quite in the same direction. As shown previously in figure 7, the lower stream leaks around the wingtip, so its direction of motion slants outboard a little, while that of the upper stream slants inboard. Whenever a mismatch of this kind occurs between neighbouring sheets of fluid, their surfaces don’t slide across one another like your shoes on a slippery path. They are unstable, and mix. Mathematically, we can think of the result as sheet of vortices lying parallel to one another like the rollers under a conveyor belt, all rotating in the same direction. They are vanishingly small in diameter, with an infinite number of them packed into the finite wingspan. Both Lanchester and Prandtl knew that within the wake, the vorticity was still present, and since parallel vortices rotating in the same direction attract one another, the trailing branches must somehow merge behind each wing. Their vision is sketched in figure 19.
Figure 19
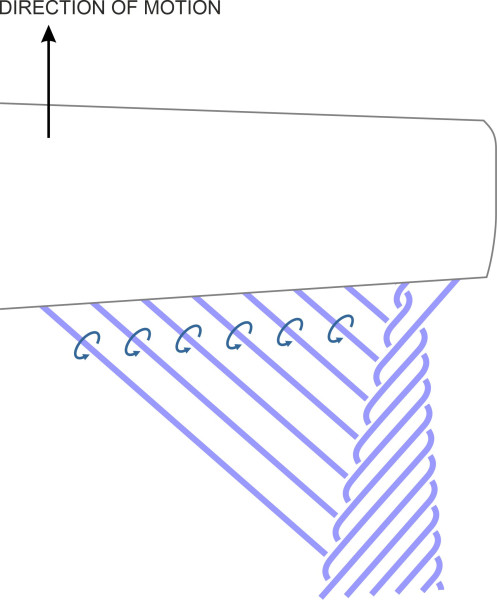
It shows a single trailing vortex that grows into a spiral as it entrains more and more filaments from the trailing edge [9]. Notice that the spiral doesn’t issue from the wingtip, but a short distance inboard. It can be shown that for the ideal case of a wing that is elliptically loaded, the lateral distance between the port and starboard trailing vortices is \(\pi /4\) or roughly 0.79 times the wingspan [11].
The intensity of circulation within each vortex varies with the aircraft speed and angle of attack. The velocity of the air parcels is highest at take-off and during the approach to landing, when the pilot raises the angle of attack and increases the engine power to ensure a safe margin of lift [12]. We can quantify their tangential velocity, or to put it more precisely, the component of their tangential velocity measured perpendicular to the aircraft’s direction of motion, as follows. According to the Kutta-Joukowski theorem, the total lift \(L\) produced by the wings is given by
(17)
\[\begin{equation} L\; =\; \rho V\Gamma \end{equation}\]By definition, for a two-dimensional vortex of circulation \(\Gamma\), the tangential velocity \(v\) of the air parcels orbiting at radius \(r\) is given by
(18)
\[\begin{equation} v\; =\; {\Gamma /2\pi r} \end{equation}\]which after substituting for \(\Gamma\) yields
(19)
\[\begin{equation} v\; =\; {L/2\pi \rho r} V \end{equation}\]For an aircraft in level flight, the lift \(L\) and the air density \(\rho\) are constant. Then from equation 19 it follows that at any given radius, \(v\) is inversely proportional to \(V\). Hence, the faster the aircraft flies, the weaker the trailing vortices. Conversely, when an aircraft slows down, the vortices become stronger. At first, this seems surprising. But when an aircraft moves slowly, it meets fewer air parcels per unit time: since the wing deflects fewer parcels, to maintain the rate of momentum transfer it must accelerate them to a greater tangential velocity. This is what happens when the pilot raises the angle of attack and deploys the flaps and slats. The increased disturbance has practical consequences near airports. If an aircraft slows down to, say, half its cruising speed, the air parcels in its trailing vortices will move twice as fast tangentially as they were moving before the descent began. This represents a significant hazard to other aircraft following the same flight path on their landing approach. The velocity generated in the trailing vortices of a large aircraft can overturn a light aircraft following several kilometres behind [12].
Postscript
The energy that flying machines pump into their trailing vortices usually goes to waste. In some circumstances, however, it can be used to positive effect. This applies more to birds rather than aircraft. When migrating over long distances, geese can recover some of the energy by flying in formation and synchronising their wingbeats to take advantage of the intermittent upwash from the bird ahead, with each bird following the one ahead but slightly above and displaced to one side [8]. Together they form a diagonal line known to airforce pilots as the echelon formation. Aircraft sometimes fly in formation, and in principle they can save energy by doing so. In 2021, the Airbus company carried out a demonstration in which two A350 jet airliners travelled in formation across the north Atlantic [13], the first exercise of this kind to take place on a long haul flight in commercial air space. They were equipped with control software designed to keep them in position 3 kilometres apart, and the result was a fuel saving of about 5%. Whether the procedure can be developed and used more widely on routine passenger services remains to be seen.
Glossary
GENERAL
\(V\)Velocity of free air stream
\(\rho\)Density of air
INFINITELY LONG WING
\(a{}_{0}\)Lift curve slope dc\({}_{l}/d\alpha\)\(c\) Wing chord
\(c_{l}\)Lift coefficient for 2D section
\(l\)Lift per unit span
\(\alpha\)Angle of attack
\(\gamma\)Circulation per unit span
FINITE WING
Overall
AR Aspect ratio
\(a_{0}\)Lift curve slope \(dC_{L}/d\alpha\)\(A\) Plan area of wing
\(b\)Wingspan
\(C_{D,i}\)Induced drag coefficient
\(C_{L}\)Lift coefficient
\(C_{M}\)Pitching moment coefficient
\(D\)Drag
\(D_{i}\)Induced drag
\(e\)Span efficiency factor
\(L\)Lift
\(M\)Pitching moment
\(\Gamma\)Circulation
Aerofoil section at location \(y\)
\(c(y)\)Wing chord at location \(y\)\(C_{L}(y)\) Lift coefficient at location \(y\)\(D_{i}(y)\) Induced drag per unit span at location \(y\)\(L(y)\) Lift per unit span at location \(y\)\(r\) Radius of orbit within trailing vortex
\(v\)Tangential velocity of air particles travelling at radius \(r\) within trailing vortex
\(W(y)\)Downwash velocity
\(y\)Distance along wing perpendicular to aircraft centreline (positive to starboard)
\(\alpha(y)\)Geometric angle of attack at location \(y\)\(\alpha_{0}(y)\) Angle of attack that produces zero lift at location \(y\)\(\varepsilon(y)\) Induced angle of attack at location \(y\)\(\Gamma(y)\) Circulation per unit span at location \(y\)
Appendix: Derivation of the circulation at mid-span
We wish to determine the circulation at the centre of the idealised wing mentioned earlier in this Section. It has finite span \(b\). The shape of the cross-section is the same at all points across the span, with constant chord \(c\) and angle of attack \(\alpha\), but because the wing is three-dimensional, the downwash varies across the span.
It will help us first to consider an infinitely long wing having the same cross-section as our finite wing, immersed in an airstream of the same velocity \(V\) but with zero downwash. Denote the section lift coefficient by \(c_{l}\) and the circulation and the lift per unit span by \(\gamma\) and \(l\) respectively. As previously described in Section A1815, to a close approximation, for a thin aerofoil section the coefficient of lift rises linearly with the angle of attack. The slope \(a_{0}\) of the curve, known as the lift-curve slope, is constant. This relationship is sketched in figure 20.
Figure 20
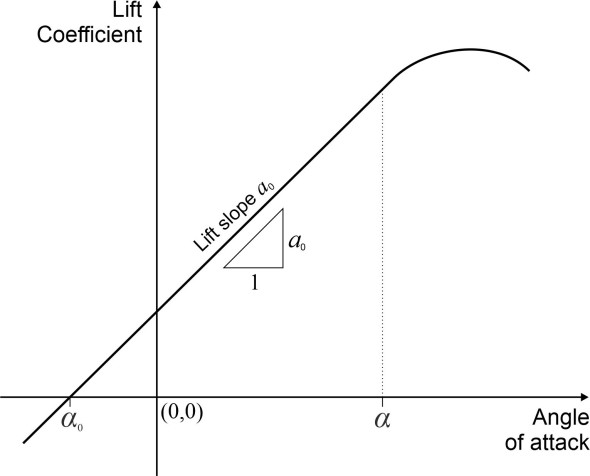
Since a cambered aerofoil can generate lift when the angle of attack \(\alpha\) is zero or even negative, the curve doesn’t pass through the origin, but through a point on the horizontal axis to the left of the origin. For any slice of our infinite wing, the curve predicts a lift coefficient equal to \(a_{0}(\alpha - \alpha_{0})\), so we can write
(20)
\[\begin{equation} c_{l} \; =\; a_{0} \left(\alpha -\alpha _{0} \right) \end{equation}\]Now we can return to our finite wing. Consider a longitudinal slice located at a perpendicular distance \(y\) from the aircraft centreline, where the downwash angle is \(\varepsilon(y)\). This changes the effective angle of attack, so that
(21)
\[\begin{equation} \begin{array} {rcl} {C{}_{L} \left(y\right)\; } & {=} & {\; a_{0} \left[\alpha -\varepsilon \left(y\right)-\alpha _{0} \right]} \\ {} & {=} & {\; c_{l} -a_{0} \varepsilon \left(y\right)} \end{array} \end{equation}\]Also, for a thin aerofoil, to a close approximation the lift-curve slope \(a_{0}\) is equal to \(2\pi\), and from equation 10, the induced angle of attack \(\varepsilon(y)\) is equal to \(\arctan[w(y)/V]\), which for small \(\varepsilon\) is approximately equal to \(w(y)/V\). After substituting these quantities on the right-hand side, we get
(22)
\[\begin{equation} C_{L} \left(y\right)\; =\; c_{l} -2\pi \left[\frac{w\left(y\right)}{V} \right] \end{equation}\]The next step involves the universal lift formula. If the slice of finite wing at location \(y\) is 1 m wide, the lift \(L(y)\) per unit span is given approximately by the expression
(23)
\[\begin{equation} L(y) = \tfrac{1}{2}\rho{V}^{2}cC_{L}(y) \end{equation}\]Also, from the Kutta-Joukowsky theorem,
(24)
\[\begin{equation} L(y) = \rho{V}\Gamma(y) \end{equation}\]Equating these two expressions and re-arranging leads to
(25)
\[\begin{equation} C_{L} \left(y\right)\; =\; \frac{2\Gamma \left(y\right)}{Vc} \end{equation}\]Applying similar reasoning to a section of the infinitely long wing, the general lift formula tells us that
(26)
\[\begin{equation} l = \tfrac{1}{2}\rho{V}^{2}cc_{l} \end{equation}\]Alternatively, from the Kutta-Joukowsky theorem,
(27)
\[\begin{equation} l = \rho{V}\gamma \end{equation}\]Equating these two and re-arranging leads to
(28)
\[\begin{equation} c_{l} = 2\gamma/Vc \end{equation}\]After substituting the right hand sides of equations equation 24 and equation 27 for \(C_{L}(y)\) and \(c_{l}\) in equation 22 we arrive at:
(29)
\[\begin{equation} \frac{2\Gamma \left(y\right)}{Vc} \; =\; \frac{2\gamma }{Vc} \; -\; 2\pi \left[\frac{w\left(y\right)}{V} \right] \end{equation}\]We are only interested in the circulation at the centre of the finite wing, so we put \(y\) = 0, and equation 28 simplifies to
(30)
\[\begin{equation} \frac{2\Gamma \left(0\right)}{Vc} \; =\; \frac{2\gamma }{Vc} \; -\; 2\pi \left[\frac{w\left(0\right)}{V} \right] \end{equation}\]Given that the circulation has an elliptical distribution, by a somewhat lengthy argument [2] it can be shown that the downwash is uniform everywhere across the wingspan, and its value \(w\) is equal to the circulation \(\Gamma\)(0) at mid-span divided by twice the wingspan thus:
(31)
\[\begin{equation} w\; =\; \frac{\Gamma (0)}{2b} \end{equation}\]Substituting in equation 29, we get
(32)
\[\begin{equation} \frac{2\Gamma (0)}{Vc} \; =\; \frac{2\gamma }{Vc} \; -\; 2\pi \left[\frac{\Gamma \left(0\right)}{2bV} \right] \end{equation}\]which after tidying up and rearranging yields:
(33)
\[\begin{equation} \Gamma (0)\; =\; \frac{\gamma }{\left(1+\frac{\pi c}{2b} \right)} \end{equation}\]The quantity \(c/b\) in the denominator is just the inverse of the aspect ratio AR, so equation 33 simplifies to
(34)
\[\begin{equation} \Gamma (0)\; =\; \frac{\gamma }{\left(1+\frac{\pi }{2.{\rm AR}} \right)} \end{equation}\]Since the denominator on the right hand side is always greater than 1, this equation tells us – as we might expect - that the circulation \(\Gamma\)(0) at the centre of a finite wing is less than the circulation \(\gamma\) of the equivalent infinite wing.