A.1716
Drag
A jet airliner travels fast. It will carry people from one side of the world to the other in roughly twenty-four hours, a level of service that was unthinkable two or three generations ago. It can do this partly because, compared with a ship or a railway train, there’s not much to slow it down. The only significant resistance is the aerodynamic drag that arises from the air flow over the wing and body surfaces, but since jet airliners fly above the clouds where the atmosphere is thin, the drag is less than it would be at ground level. Before going any further, you may find it helpful to consult the introductory material on fluid dynamics set out in Sections in F2020 to F1816. Here, we’ll try to draw out the key points relating to aircraft flight, and particularly how the drag is affected by the speed of the aircraft, its size, and its body shape.
Air flow and the body surface
What causes drag, or indeed, any of the aerodynamic forces? Isaac Newton was among the first to attempt a logical explanation of aerodynamic forces. He pictured the atmosphere as a collection of tiny elastic balls. They move around independently, and when they collide with the body in large numbers, they apply a steady force that may result in lift and will always retard the body’s motion. But his predictions didn’t tally with reality, and eventually, scientists turned to a different model in which gases and liquids were pictured as a smooth continuum that obeyed the laws of ‘potential flow’. But for over a hundred years, they struggled to explain aerodynamic forces because according to potential flow theory, fluids are non-viscous (there is no friction between the particles) and the net force acting on a moving body is zero.
We now know that gas molecules jostle one another. Each follows a random path and collides with others in its path, so that instead of acting alone, the particles move around in small parcels, as if connected – somewhat tenuously - at the molecular level. It’s these internal movements that make fluid parcels viscous: they apply shear forces to each other by mixing and exchanging momentum.
Stress and strain
Fluid parcels also apply forces to the surface of a body over which they are moving. For convenience, we divide the forces into two components: normal pressure, and shear stress (figure 1). Normal pressure is easy to understand. Imagine a fluid parcel pressing against the surface of an aircraft wing. Inside the parcel, molecules are moving about and sometimes collide with the wing surface: the steady stream of impacts results in a pressure force perpendicular to the skin.
Figure 1
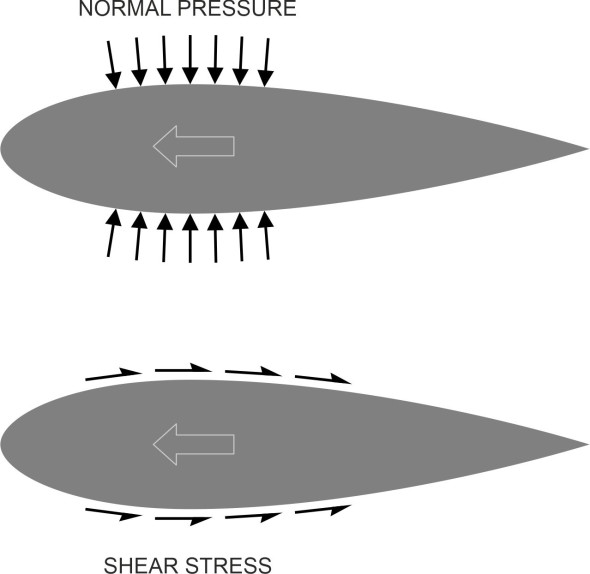
Shear stress works in a less obvious way. We normally think of it as something that happens at the interface between two rigid bodies such as car tyre and the road surface on which it stands. It may be on a downhill slope, but if the car is parked with the brakes on, there should be enough friction between the road surface and tyres to hold the vehicle in place. There is no motion involved. Now imagine the car moving along the road. Air parcels will flow over the roof and apply a friction force that tends to hold the car back, but only because there is relative motion between the air parcels and the body surface.
Figure 2
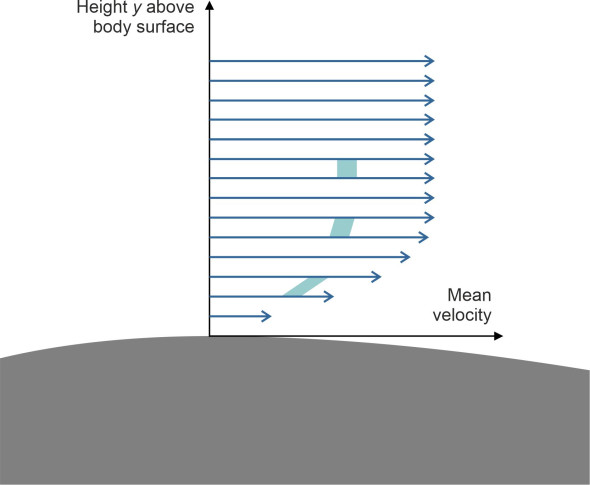
To understand how this happens, we’ll focus on a small area of roof and picture the air parcels moving smoothly and steadily over the top. We cannot observe the behaviour of individual gas molecules, but it is widely understood that owing to electrostatic forces, those at the bottom of the boundary layer (\(y=0\)) are momentarily attracted to the roof and come to a halt as shown in figure 2. Those further away experience less attraction and continue to move in the direction of the free stream, albeit at a low speed. Those further away still move a little faster, so the velocity increases with height \(y\) above the interface. This is because of the shear stress that the parcels exert on each other at different levels within the boundary layer: they are exchanging molecules with their neighbours, so that their speeds tend to equalise and their shapes become distorted as if the parcels were sticking to one another. This is the underlying mechanism of viscosity. The viscosity of air is relatively small compared with the viscosity of a liquid such as water, but it can lead to significant aerodynamic forces.
The boundary layer
So friction slows down the motion of the air parcels close to the body surface. The affected region is known as the boundary layer, which usually defined as the area within which the velocity is slowed by 1% or more relative to the velocity \(V\) of the undisturbed air stream. The picture is complicated by the fact that for most transport vehicles, the fluid parcels don’t follow a smooth path through the flow field. As we saw in Section F1917, when moving at high speed relative to the body surface, the flow is usually turbulent, and this is certainly the case with aircraft. At the microscopic level, a series of wave-like disturbances develops next to the vehicle skin. The waves generate tiny vortices that hover above the surface and decay into turbulent patches than eventually coalesce into a fully turbulent stream. Individual fluid parcels move erratically, not only parallel to the body surface, but at different angles to it, so they transfer momentum between different levels. This increases the shear stress and results in a mean velocity distribution of the kind shown in figure 2. The curve shows only the component of velocity in the \(x\)-direction. At the surface itself, it is zero, rising towards the free stream velocity with increasing height above the surface.
In spite of many decades of research, there is no exact formula for the thickness \(\delta\) of a turbulent boundary layer or the level of drag \(D\) it generates. To give you some idea of the quantities involved for the wing of a passenger aircraft, we can use semi-empirical formulae based on the work of Gustav Prandtl and his assistants in Germany for flow over a smooth, flat plate. There are many different versions with slightly different numerical coefficients. Here, we’ll use the ones quoted in [6], which assume a simplified model of the boundary layer in which the flow is turbulent throughout. Our starting point is its thickness \(\delta\):
(1)
\[\begin{equation} \delta \; =\; 0.370xRe_{x} {}^{-\tfrac{1}{5} } \; =\; 0.370\nu ^{\tfrac{1}{5} } U^{-\tfrac{1}{5} } x^{\tfrac{4}{5} } \end{equation}\]where \(x\) is the distance measured along the plate from the leading edge, \({\rm Re}\) is Reynolds number, here equal to \(Ux/\upsilon\), \(U\) is the free stream velocity, and \(\upsilon\) is the kinematic viscosity of air. You can find further details in Section F1917.
The formula tells us that the boundary layer over an aircraft wing is quite thin. For a light aircraft, it may be less than 10 mm thick at mid-chord. For a larger passenger jet, it may be closer to 50 mm, but it is still small compared with the wing thickness at mid-section (figure 3). However, the thickness is not uniform. Figure 4 shows how it varies over a flat plate, starting at zero at the leading edge and growing steadily to a maximum at the trailing edge. And when the aircraft speed rises, the thickness falls.
Figure 3
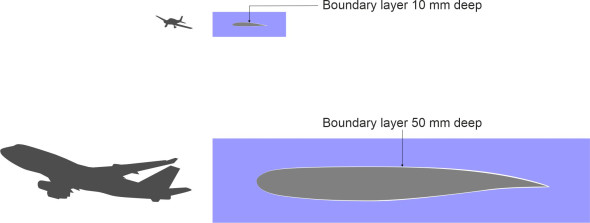
Figure 4

The concept of the boundary layer as a distinct entity was developed by Ludwig Prandtl and his colleagues at Göttingen during the early years of the twentieth century. For the first time, it enabled the pioneers of aviation to design flying machines in a systematic way. Until then, potential flow theory had failed because it assumed that the air was non-viscous, and had nothing to say about lift or drag. But research revealed that viscosity produces significant forces only in regions of high shear close to the body surface. Further away, the flow field could be modelled as if the viscosity were zero, and since the solutions for simple body shapes were known, they could be combined to generate the flow pattern around more complicated shapes. So friction drag could be estimated by assuming a 2-dimensional boundary layer wrapped around the surface. For most purposes, it was sufficiently thin to be treated locally as a flat sheet.
Surface roughness
As you might expect, the friction drag depends partly on the smoothness of the body surface. During the 1930s, aircraft manufacturers tried to maintain a laminar boundary layer across the whole wing by polishing the skin and removing the bumps and hollows produced by the rivets that secured it to the underlying framework. But in normal service, the skin became scratched and dented so that the quality of the surface deteriorated, the flow became turbulent, and the friction increased. There is a standard scale for surface roughness. It is based on wind tunnel tests with flat metal plates, each with a carefully graded layer of sand glued to its surface. Sand grains of different size yield different friction drag coefficients, and it turns out that the surface of a modern transport aircraft in prime condition corresponds to a grain size of about 0.04 mm, which results in a modest but significant friction drag increase. For other machines, it may be larger [8].
Drag components
By comparison with the lift force, the drag force acting on an aircraft is smaller but it has an appreciable effect on its performance. For a large transport aircraft, it might be as much as 100 kN, roughly equivalent to a weight of 10 tonnes. Also, it arises from a combination of normal pressure and friction forces acting on different parts of the structure as described in Section F1816. We’ve already covered the special case of induced drag in Section A1810. Here, we’ll expand on other sources of aircraft drag and look at some typical values.
Skin friction drag
An aircraft is different from most other vehicles in the sense that every part is streamlined. The fuselage is long and slender, the wings are thin, and both fuselage and wings present a small frontal area to the oncoming air flow. On the other hand, they have a large surface area, the wings particularly so, and the motion of the boundary layer over these surfaces creates a significant shear force. As a result, when flying at subsonic speeds, skin friction is responsible for almost half the total drag for the aircraft ’ [4]. However, there isn’t a reliable formula for predicting its value, because the boundary layer is usually turbulent, and no-one has yet been able to model turbulence in a scientifically convincing way. However, one can get a rough estimate of the friction drag based on empirical studies of the flow over a flat plate arranged parallel to the free stream. Several alternative formulae have been put forward, and here we shall use the ones that appear in [6]. If we denote the free stream velocity by \(U\), the density of air by \(\rho\), and the dynamic viscosity of air by the Greek letter \(\upsilon\), then the shear stress \(\tau _{w}\) at distance \(x\) from the leading edge of the plate is approximately equal to
(2)
\[\begin{equation} \tau _{w} \; =\; 0.0288\rho U^{\tfrac{9}{5} } \nu ^{\tfrac{1}{5} } x^{-\tfrac{1}{5} } \end{equation}\]By integrating the shear stress over the width \(b\) and length \(l\) of the plate, we get an expression for the total shear force acting on both sides of the plate:
(3)
\[\begin{equation} D\; =\; 0.0720\rho U^{\tfrac{9}{5} } \nu ^{\tfrac{1}{5} } bl^{\tfrac{4}{5} } \end{equation}\]As an example, we’ll use these formulae to estimate the friction drag created by the wings of a light aircraft, on the assumption that each wing generates the same friction drag as a flat plate of the same plan area and shape. Assume a rectangular wing whose span is 12 m and chord 1 m. Light aircraft fly at altitudes in the region of 3000 m, and Table 1 sets out the relevant data for atmospheric conditions at this height.
Table 1: Atmospheric conditions encountered by a light aircraft
| Altitude | 3 000 m |
| Aircraft speed | 110 m s\({}^{-1}\) |
| Air density \(\rho\) | 0.9107 kg m\({}^{-3}\) |
| Air viscosity \(\nu\) | 1.461 \(\mathrm{\times}\) 10\({}^{-5}\) m\({}^{2}\) s\({}^{-1}\) |
From equation 2, the shear stress at half-chord (\(x\) = 0.5 m) comes to about 15 Pa. From equation 3, the total friction drag for the wing comes to around 490 N, which is roughly equivalent to the force you would need to push-start a family car. Incidentally, for a jet airliner, the shear stresses are larger but not as large as you might think. Although jets travel at a lot faster, they do so at altitudes where the air is thinner and both the density and viscosity are less. When you do the arithmetic, equation 2 shows that the shear stress at mid-chord is not much more than the value for a light aircraft. However, the area of the wing is greater so when the stress is integrated over the whole surface, it results in a much larger drag force.
Pressure drag
Other forms of drag act in a different way. In addition to rubbing along the surface, the air parcels apply pressure at right-angles to it, and the pressure drag is the sum of the components aligned in the direction of the free stream, which tend to slow the aircraft down. There are several distinct sources of pressure drag. The first is induced drag, which we encountered in the last Section (A1810). It is a by-product of the lift generated by the wings, which deflects the oncoming air flow downwards and changes the pressure distribution across the wing surface. As a result, the direction of the lift force tilts aft through a small angle so that the lift itself acts partly to oppose the aircraft’s motion.
The second component is separation drag. As explained in Section F1816, the air parcels in the boundary layer can separate from the body surface of a fast-moving vehicle before they arrive at the aft stagnation point.
Figure 5
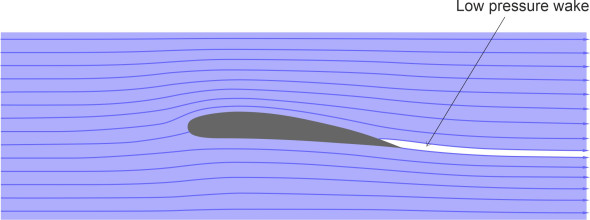
figure 5 shows how this happens at the trailing edge of an aircraft wing. It leads to a turbulent wake in which the air pressure is substantially reduced, and it is the difference in air pressure between the front and rear of the wing that causes the drag: its magnitude depends largely on the cross-sectional area of the wake. If the boundary layer separates close to the trailing edge, the area is small, but if it separates further forward, the area is larger. As we’ll see later, a similar process occurs towards the rear of the fuselage. Since one cannot easily predict the point of separation, there’s no established method for predicting the retarding force and the designer must rely on empirical data instead. Also, a thick boundary layer diverts flow away from the body surface, increases the depth of the wake, and increases the pressure drag (figure 6).
Figure 6

The additional thickness is defined as the amount by which the streamline on the edge of the boundary layer is deflected away from the body surface. It is called the displacement thickness and is usually denoted by \(\delta *\). Typically, for a turbulent boundary layer, it is quite small, being roughly equal to \(\delta /8\), where \(\delta\) is the thickness of the boundary layer itself [11].
The third component is the trim drag, a drag penalty incurred by any aircraft whose wings have a cambered profile. A cambered aerofoil tends to pitch the aircraft nose-down, and in order to keep it flying level when the control column is located in the neutral position, the tailplane is usually fixed at a negative angle of attack. As well as keeping the nose up in flight, this results in a small increase in pressure drag amounting to 1 - 2% of the total [10].
Finally, when an aircraft flies close to the speed of sound, shock waves begin to form over the wings and in other places around the vehicle surface that affect the pressure distribution and lead to a marked increase in the total drag. We’ll deal with high-speed flight separately in the next Section A1615.
Mapping the components
We’ve sifted through the main components of aircraft drag, and now we can arrange them into a more-or-less systematic framework. The aim is to highlight any factors they have in common, and to pick out the ones that might be reduced to improve the aircraft’s aerodynamic efficiency. One way of arranging the components is shown in figure 7. At the top is the induced drag. Unlike the other drag sources, it arises from the lift-generating process, being effectively produced by the lift force itself. As already mentioned, it varies with the angle of attack.
Figure 7
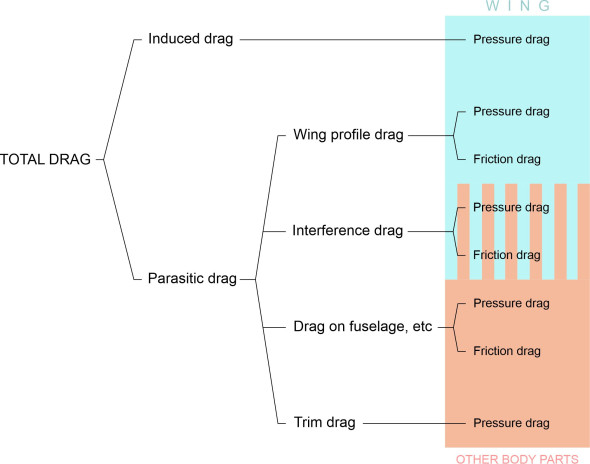
All the remaining drag components are grouped under the heading parasitic drag. They are not a direct consequence of the lift, and in principle, could be eliminated by careful aerodynamic design – in fact the aircraft would fly faster and more efficiently without them. They act on all parts of the machine, including the wings themselves. The component that acts on the wings is sometimes called ‘profile drag’. It comprises elements of both pressure drag and friction drag. The friction drag element is the larger of the two, and does not vary significantly with the angle of attack in normal flight. However, the pressure drag does. As shown earlier in figure 5, it is caused by separation of the boundary layer, and within the region of detached flow is a low-pressure wake that applies a drag force to the wing surface.
Figure 8
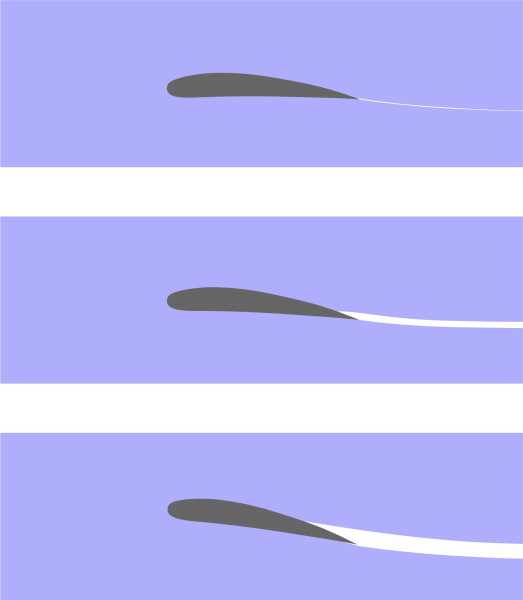
figure 8 shows how the depth of the wake – and therefore the pressure drag – changes with the angle of attack. It’s an example of the way in which aircraft differ from land vehicles in that they are more sensitive to small changes in pitch. The aerodynamic forces acting on a car don’t change a great deal when the front wheels rise over a bump, whereas in the case of an aircraft, when the pilot raises the nose during take-off, the wings lift it off the ground. Effectively, the geometry of the aerofoil changes relative to the oncoming air flow, and in addition to the lift, the drag increases too.
Other parts of the aircraft such as the fuselage produce parasitic drag in the same way as the wings. The total for each part consists of a pressure drag element that varies with the angle of attack, together with a friction drag element that does not. Among these parasitic components is one we haven’t mentioned so far: interference drag. It arises from the way that different parts of an aircraft are joined together. For example, the wings jut out from the fuselage to leave a re-entrant angle at the root. Within this angle, the boundary layer attached to the wing surface and the boundary layer attached to the fuselage overlap and compete for space.
Figure 9
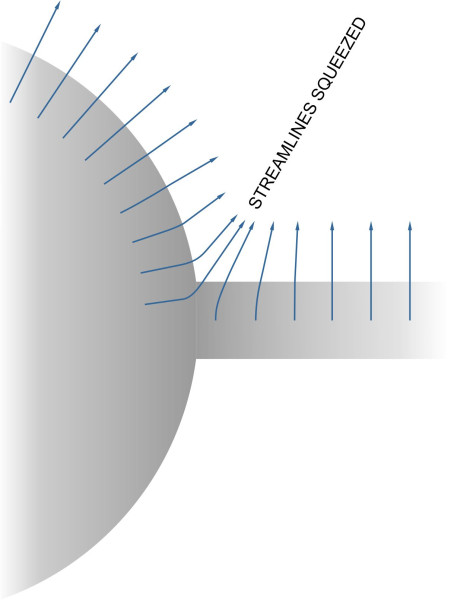
figure 9 shows part of an aircraft where the wing joins the fuselage, seen from the front. The blue arrows represent the motion of air parcels in the two boundary layers. You can see that in the region of overlap, the streamlines are squeezed together. Here, Bernoulli’s law tells us that the velocity of the air parcels must rise as they pass through the bottleneck, so as shown in figure 10, the friction drag that acts on the shaded area must increase.
Figure 10
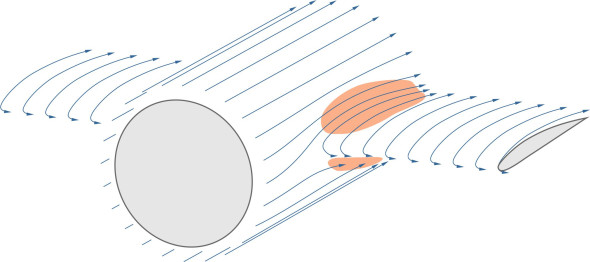
This means that the total friction drag is greater than it would be if the wings and fuselage were analysed separately: the whole is greater than the sum of its parts. There may also be greater turbulence in this area, and for an aircraft flying at subsonic speed, the velocity increase may create a shock wave. A similar phenomenon occurs where the tailplane is attached to the fuselage or fin, and other locations where there are re-entrant angles on the body surface such as the engine nacelles. In all these cases, the smaller the angle, the greater the interference drag. The designer can reduce it by inserting a fillet or a fairing to spread the zone of interference over a wider area and ease the acceleration of air parcels through the bottleneck.
Total drag
It costs a great deal to develop a new aircraft. Realistic forecasts of the aircraft’s aerodynamic performance are important, and at the heart of the problem lie two main variables: lift and drag. Lift together with certain elements of the drag can be predicted using theoretical models, but the total drag cannot. Instead, the manufacturer will begin with estimates based on the known performance of existing models together with the results of computer simulation exercises, wind tunnel tests, and trials with prototype aircraft.
Drag coefficients
For much of the time, designers work in terms of drag coefficients rather than the drag forces themselves. In the case of a sports car, the drag coefficient \(C_{D}\) is often quoted as a single number: it’s a convenient way of comparing its aerodynamic efficiency with that of other vehicles. It is also a convenient tool for the designer, because it summarises the effect of the car’s shape on its aerodynamic resistance – the same number may be applied to a larger or smaller version of the same body moving at different speeds, and is particularly useful for estimating the drag for the full-size body from the results of wind tunnel tests with a scale model. The drag force \(D\) can then be estimated via the semi-empirical formula
(4)
\[\begin{equation} D\; =\; \tfrac{1}{2} \rho V^{2} AC_{D} \end{equation}\]where \(\rho\) is the air density, \(V\) is the velocity, and \(A\) is a parameter that represents the body’s physical size, which for a car is usually the cross-sectional area as seen from the front.
However, in the case of an aircraft the problem is more complicated. The value of \(C_{D}\) varies with the Reynolds number \({\rm Re}\) and the Mach number \({\rm Ma}\), and the analyst must allow for this when scaling up model results (for more details see Section F1817). Here, though, we’ll concentrate on a more pressing issue: for a given aircraft, it varies from moment to moment during each flight. We’ve already hinted at the reasons for this, which are twofold. The first is that when the pilot raises or lowers the airspeed by adjusting the throttle setting, assuming the aircraft continues in level flight, the angle of attack \(\alpha\) must change so the wings can sustain the required lift. In particular, to fly slowly, \(\alpha\) must rise, and with it, the drag coefficient. Second, the fuel accounts for a substantial proportion of the aircraft’s weight, which will fall steadily throughout the journey. To maintain level flight, the lift must fall accordingly, and to maintain a constant speed, the angle of attack and drag coefficient must fall too.
It seems that to understand how an aircraft performs, one must distinguish between the drag components that vary with the angle of attack, and those that don’t. In what follows, we’ll work in terms of drag coefficients, taking advantage of the fact that they can be added together in the same way as the drag forces themselves. For example, the two main components are (a) the parasitic drag which we’ll denote by \(D_{p}\), and (b) the induced drag, denoted by \(D_{i}\). Hence:
(5)
\[\begin{equation} D\; =\; D_{p} \; +\; D_{i} \end{equation}\]Denoting the parasitic drag coefficient by \(C_{D} {}_{,p}\) and the induced drag coefficient by \(C_{D} {}_{,i}\), it’s not difficult to show that:
(6)
\[\begin{equation} C_{D} \; =\; C_{D,p} \; +\; C_{D,i} \end{equation}\]The relationship between drag and lift
Let’s look at the two terms on the right-hand side of equation 6. The second term is the coefficient of induced drag. It varies with the angle of attack, and since the lift coefficient \(C_{L}\) itself is a function of the angle of attack, we can treat \(C_{D} {}_{,i}\) as a function of \(C_{L}\), because we know that when the lift rises, the induced drag rises too. In fact, from equation 12 in Section A1810 we have:
(7)
\[\begin{equation} C_{D,i} \; =\; {C_{L} {}^{2} /\pi .{\rm AR}.} e \end{equation}\]where \({\rm AR}\) is the aspect ratio and \(e\) is a dimensionless number called the ‘span efficiency factor’. Now return to the first term on the right-hand side of equation 6, which is the parasitic drag coefficient \(C_{D} {}_{,p}\). It covers all the remaining drag components that relate to different parts of the aircraft, including the wings, fuselage, tail, engine nacelles, and landing gear. The drag associated with some of these components varies with the angle of attack, while others stay roughly constant. Experience has shown its value can be expressed approximately in the form
(8)
\[\begin{equation} C_{D,p} \; =\; C_{D,0} \; +\; rC_{L} {}^{2} \end{equation}\]where \(C_{D,0}\) is the parasitic drag at zero angle of attack and \(r\) is a constant. Now we can substitute the right-hand side of equation 8 for \(C_{D} {}_{,p}\) in equation 6, together with the right-hand side of equation 7 for \(C_{D} {}_{,i}\) to get:
(9)
\[\begin{equation} \begin{array} {rcl} {C{}_{D} \; } & {=} & {\; C_{D,0} \; +\; rC_{L} {}^{2} \; +\; \frac{C_{L} {}^{2} }{\pi .{\rm AR}.e} } \\ {} & {=} & {\; C_{D,0} \; +\; \left(r+\frac{1}{\pi .{\rm AR}.e} \right)C_{L} {}^{2} } \end{array} \end{equation}\]in which the first term on the right-hand side is independent of lift, and the second is proportional to the square of the lift coefficient. It is common practice to modify this equation thus [9]:
(10)
\[\begin{equation} C_{D} \; =\; C_{D,0} +\frac{C_{L} {}^{2} }{\pi .{\rm AR}.E} \end{equation}\]where the quantity \(E\) is the Oswald Efficiency Factor, named after the NACA aerodynamicist who conceived it. Please note that the symbol \(E\) is not standard notation. We use it here to avoid confusion, because in textbooks, the Oswald efficiency factor is denoted by the same symbol \(e\) as the span efficiency factor, although it has a different numerical value, typically around 0.7 – 0.85, as compared with 0.9 – 1.0 for the latter [3].
Figure 11
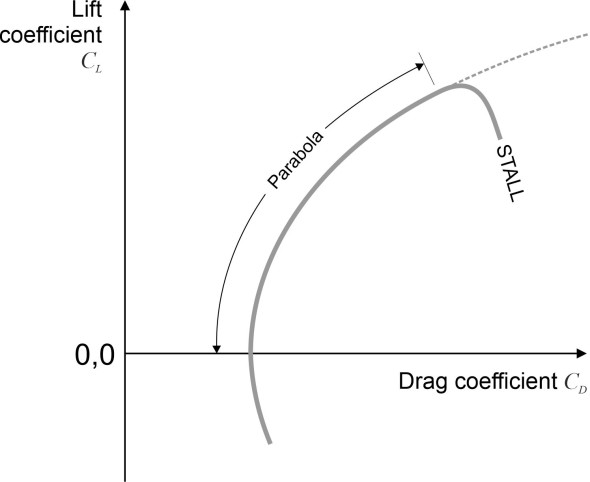
When plotted as a graph, equation 10 is known as the drag polar. A sketch of the curve is shown in figure 11. Mathematically, it takes the form of a parabola, and for any given aircraft, it traces out the relationship between lift and drag. The parabola is turned on its side and you can see from the kink at the top of the curve that the relationship breaks down near the point of maximum lift, which indicates a stalled condition. Later in Section A1215 we’ll see how the curve can be used to assess the efficiency of the aircraft in flight.
Empirical estimation of aircraft drag
There are no analytical formulae for predicting drag, but to get a rough estimate, the designer can break down the aircraft body into simple geometrical shapes for which the drag coefficients have already been determined through a mixture of theory and experiment. The fuselage, for example, can be treated as an elongated teardrop or zeppelin, a classical aerodynamic form. With some adjustments, the engine nacelles may be handled in a similar way. The wings are a more difficult problem. First, they create induced drag that is related to the lift vector as described earlier in Section A1815. Second, along with the fin and tailplane they create a great deal of friction drag that can be estimated using empirical formulae set out in Section F1917 for the shear stress imposed by the boundary layer. Thirdly, as we saw earlier, the wings generate pressure drag that arises from separation near the trailing edge. It is usually smaller than the friction drag but less easy to quantify.
The major body parts account for roughly 90% of the total drag for a modern transport aircraft. The remainder comes from less obvious sources like (a) surface roughness, (b) bumps and excrescences, and (c) larger-scale distortions of the underlying aerodynamic shape. An example in this last category – common in large commercial aircraft - is the shape of the rear fuselage. It is basically a zeppelin profile with the lower surface sweeping upwards somewhat abruptly near the tail so it doesn’t drag along the runway on take-off (see Figure 16 in Section F1616). Another example occurs in the wings. It’s not immediately obvious to the naked eye, but they are often designed so the angle of attack changes between the root and wingtip, effectively twisting the aerofoil a little to reduce the likelihood of tip stalling, and the twist may result in extra parasitic drag. As mentioned earlier, there is also interference drag between the wings and fuselage. In no particular order, other items include radio antennae, scoops, drains, the frame around the cockpit windshield, gaps around the undercarriage doors and around the control surfaces such as the ailerons and elevators.
Drag measurement in wind tunnels
To test the reliability of their estimates, aircraft designers have always resorted to measurements obtained from scale models ‘flown’ in a wind tunnel. The process has a long history. It goes back to 1901-2, when the Wright brothers were building one of their first gliders. The wings produced only a fraction of the lift they expected, and in desperation they built a 1.8 m-long wind tunnel to measure the lifting power of alternative designs [2]. The results were successful, and it wasn’t long before other pioneers began to do the same, using wind tunnels to provide estimates of lift and drag that couldn’t be obtained in any other way. Wind tunnels are expensive to build and maintain, and in later decades, governments began to invest in large-scale facilities to support the development of military air power along with commercial air transport.
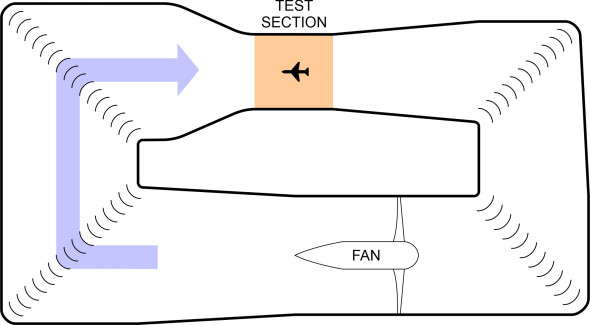
The idea behind a wind tunnel is simple. Essentially, it’s a tube containing a fan driven by an electric motor. For testing at subsonic speeds, the tunnel is laid out in the form of a closed circuit as shown in figure 12, with vanes that guide the flow round the corners. The diameter narrows on the approach to the test section, where the air accelerates to produce a stable, uniform high-speed flow. Mounted in this flow is a scale model that simulates an aircraft moving through the atmosphere. The model is connected to transducers that measure the aerodynamic forces.
Figure 12
For the tunnel to be useful, one needs a reliable method for scaling up the results from the model to a full-size aircraft. Here, we’ll focus on the drag force. For a model with a wing plan area \(A\) flying at velocity \(V\) in air of density \(\rho\), the total drag \(D\) can be expressed in terms of the drag coefficient \(C_{D}\) as previously shown in equation 4. The drag coefficient is dimensionless and is reckoned to convey the effect of shape on the aerodynamic forces, so in principle the same value should apply to bodies of the shape concerned independently of their size. The values of \(A\), \(V\) and \(\rho\) are known both for the model in the wind tunnel and for the prototype aircraft that it is intended to simulate. One can estimate the drag coefficient for the model by measuring the drag it generates in the wind tunnel, substituting its value together with the known values of \(A\), \(V\) and \(\rho\) into equation 4, and rearranging to get \(C_{D}\). The question is whether the resulting value of \(C_{D}\) can be applied to the full-size aircraft, and if so, under what conditions. It’s a technical issue, summarised briefly in the Appendix to this Section. You can find further details in, for example, [13].
Simulation
Today, engineers are using digital computers to estimate drag in a different way. With the aid of Computational Fluid Dynamics software (CFD), it is possible to simulate the air flow around a vehicle at a level of detail that would have seemed unimaginable a few years ago. In fact, computers have played a supporting role in aerodynamics since the 1960s, taking on a greater share of the task with each advance in computing power. A comprehensive account is set out in [14]; here, we’ll sketch some of the key steps.
During what might be called the first stage of computational aerodynamics, designers adapted potential flow theory to handle more realistic aerofoil shapes for which no mathematical solution existed. Variations of this method are still used today. It begins with a uniform flow field in which we picture the boundary of an aerofoil that is divided into straight-line segments (figure 13).
Figure 13

The aim is to divert the flow around this boundary, by inserting a small source into each segment that injects fluid into the flow field at a steady rate, or where necessary, a sink that draws fluid out again. In what follows we’ll think of each sink as a ‘negative’ source. All the positive and negative sources are small perturbations that together re-shape the pattern of streamlines to conform with the wing profile. However, to simulate a smooth surface, rather than being concentrated at a single point, each source is uniformly spread over the segment to which it is attached: in effect it becomes an array of infinitesimally small line sources squashed together so their streamlines emerge perpendicular to the wing surface. The total strength of the source differs from one segment to the next, and the problem is to adjust all the source strengths individually so that the resulting flow pattern is compatible with the shape of the aerofoil - in effect, the boundary becomes a streamline (figure 14).
Figure 14
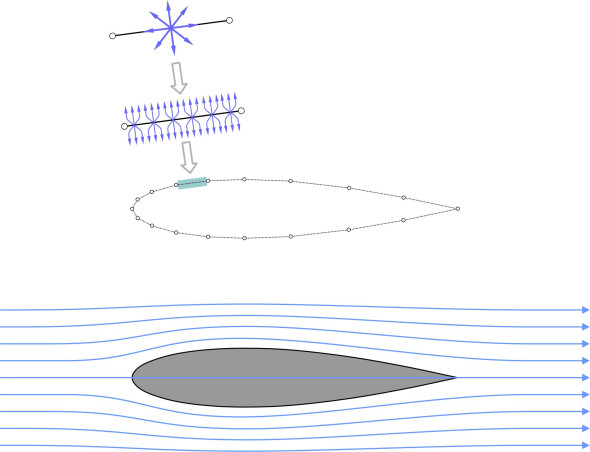
This is done by solving the set of simultaneous equations that governs the potential flow field. This is the rationale for the ‘panel method’ described earlier in Section A1816 for non-lifting aerofoils, and the ‘strip method’ used in the analysis of marine vessels (see Section M1115).
The perturbation in each segment doesn’t have to be a source or sink. Instead, it might be a vortex, or a ‘doublet’ (essentially a combined source and sink). Over the years, variations of this method have been developed using different types of perturbation applied singly or in combination to each segment. From the resulting flow pattern, one can use Bernoulli’s theorem to calculate the air pressure and velocity at each point around the profile, and thence the aerodynamic forces acting on the wing. Since the flow is assumed to be non-viscous, there is no friction drag or pressure drag, which must be handled separately using one of the empirical boundary layer models mentioned earlier.
Figure 15
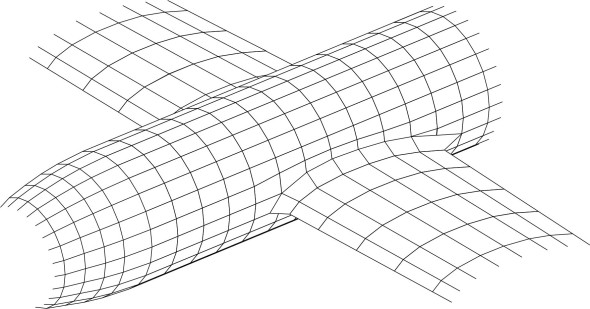
During the second stage of development, an analogous procedure was applied to three-dimensional bodies, whose surface was divided into small triangular or quadrilateral panels, and an elementary flow perturbation applied to each panel (figure 15). This became the principal method for assessing alternative aircraft configurations during the early stages of the design process. For obvious reasons, handling a three-dimensional body surface requires a faster computer with a larger memory.
The third stage is still in progress. Here, the whole of the flow field around the aircraft is broken down into a ‘mesh’ of small, three-dimensional elements. To illustrate the principle, figure 16 shows a notional aircraft body with some of the elements shaded in blue. For a
Figure 16
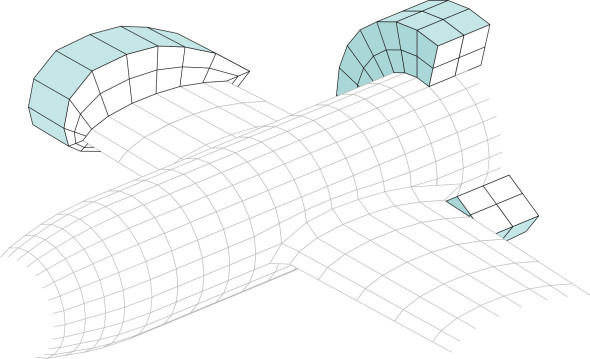
real aircraft, the geometry is more complex, because the mesh size varies from place to place around the body surface to facilitate accurate simulation. The flow through each element is assumed to obey the Navier-Stokes equations. Simulation at this level of detail requires considerable computing power, and the process of setting up the mesh accounts for a large proportion of the total cost. Since the flow over an aircraft is almost always turbulent, the pattern of flow within each element varies over time. Until recently, users have relied on solutions that represent the ‘average’ flow. They are known as RANSE methods (Random Averaged Navier-Stokes Equations). More recent applications can simulate unsteady flow, in which large-scale eddies and vortices arise when an aircraft stalls or loses stability during a violent manoeuvre (Cummings et al 15). But this requires computing power of a different order, with a large storage facility to hold the results so they can be visualised and played back in real time. Investigating the whole range of turbulent behaviour, which takes place on a range of scales down to the microscopic level, is beyond the capacity of the most powerful super-computers available, at least for the time being.
Body shape
Aerodynamic drag is important for any moving vehicle, because it contributes to resistance. But for an aircraft, it is doubly important. Imagine, for example, that the manufacturer of an existing model decides to increase its cruising speed. It will need more powerful engines, which will be heavier and consume more fuel. More lift will be needed to support the extra weight. This implies larger wings, which themselves result in more drag. You can see where this is going: at the heart of an aircraft’s performance lie three interconnected variables. They are weight, lift and drag, and if one of them changes, the consequences may escalate.
Aerodynamic configuration
During the early stages of designing an aircraft, the problem of forecasting its behaviour can be simplified by breaking it down into its constituent parts as described in Section F1616 and analysing them separately. The main structural components are
- the fuselage
- the wings
- the tail structure and
- the engine nacelles.
Assume the volume of the fuselage is fixed according to the payload it is designed to carry. It is essentially a body of revolution, and it creates two distinct types of drag as shown in figure 17: friction drag acting over the body surface, and pressure drag that arises from the low-pressure wake left behind where the air separates from the body profile aft of the widest point.
Figure 17
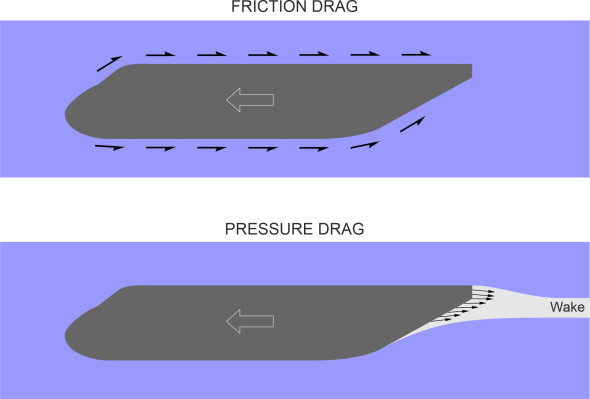
A long, slender fuselage will have a large surface area that generates more friction drag, whereas a short fuselage will have less surface area but a larger diameter and a larger wake. The optimum proportions for aircraft are a compromise, with a length-to-width ratio that rises with increasing Reynolds number. And like a Zeppelin, it should have rounded nose and pointed tail. The wings are different – they need a large surface area to generate lift, and therefore skin friction accounts for most of the drag. Nevertheless, in subsonic flight the cross-section is subject to the same basic requirement of a rounded nose and a sharp trailing edge – you can picture an aerofoil as having an extended Zeppelin profile. Not all aircraft fit this pattern. For example, the wings and fuselage of a military fighter jet may blend together in such a way that one cannot easily distinguish between the wings and fuselage. Also, military aircraft tend to fly at supersonic speeds where the optimum profile is very different from that of a subsonic aircraft. We’ll consider high-speed aircraft separately in Sections A1615 and A1410.
While we’re on the subject, it’s interesting to compare the shapes of flying birds and insects with aircraft. Do they obey the same aerodynamic rules? These issues have attacted the attention of eminent scientists and some of the results can be found in Alexander [12], Dalton [15], and Denny and McFadzean [16]. If you ignore the beak, when you view them from the side, most birds have a round nose and a pointed tail, not very different from the optimum ‘zeppelin’ model. Oddly, however, insects – the most numerous of all flying creatures – do not. An insect body has an irregular shape, with deep folds separating the head, thorax and abdomen, which are covered in hairs or scaly protuberances (figure 18).
Figure 18
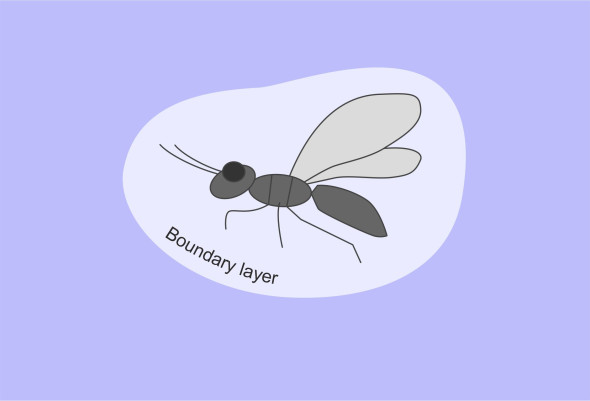
The combination of low travel speed and small size means that the Reynolds number is small, so friction drag dominates, but insects carry around with them a relatively thick boundary layer that seems to bridge across the irregularities.
Drag reduction measures
In the world of aviation, drag greatly reduces performance. Here, we’ll introduce three measures that have been widely used to control it: riblets, fillets, and winglets. They are interesting because none of them conform to what we might expect: a smooth, streamlined profile, with the minimum frontal area and no protuberances to interfere with the air flow. Riblets are the most exotic of the three. They are small grooves in the body surface aligned in the direction of air flow within the boundary layer. At a certain velocity, microscopic ‘lambda vortices’ detach from the body surface and burst, triggering the transition from laminar to turbulent flow. Experiments with adhesive plastic sheets with grooves around 0.05 mm wide and 0.05 mm deep appear to interfere with the process [7] and reduce skin friction drag by 5 – 8% [5]. They have been used for racing yachts but haven’t been widely adopted within the aircraft industry.
On the other hand, fillets and winglets are widely used on commercial aircraft. We have already mentioned fillets. They are ‘fairings’ designed to shift the air flow away from re-entrant angles, particularly between the wings and fuselage, that absorb energy and contribute to drag. In a sense, a winglet is an extension to the wing. It’s not intended to create lift, but to curtail induced drag. Induced drag arises because the lift vector tilts a little aft as shown in Figure 22 in Section A1810. By effectively increasing the wingspan, a winglet moves the trailing vortex further away from the fuselage, reduces the downdraught at each point along the main section of wing, and thereby reduces the tilted lift vector. The earliest form of winglet was conceived by Richard Whitcomb at NACA. It had two distinct blades, one located at the leading edge and projecting downwards at an angle from the wingtip. The other was placed aft and projected upwards. Modern variants of this design have a simpler layout, with the two blades overlapping as shown in the upper part of figure 19.
Figure 19
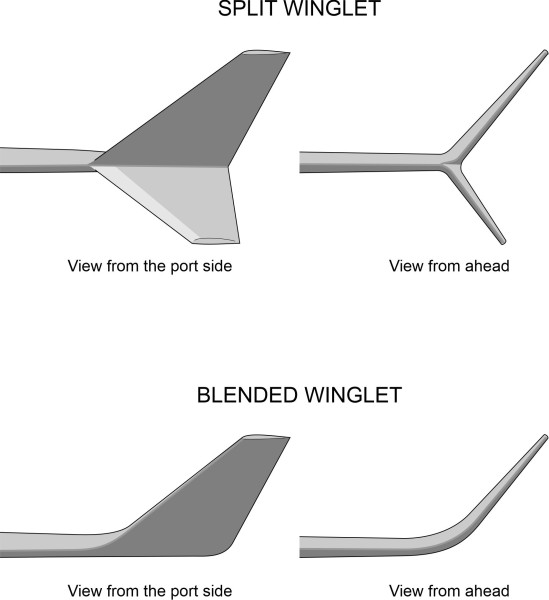
Essentially, they divide the main wing vortex into two separate – and smaller - components. A second variant, now coming into widespread use, has a single blade angled upwards along a curve that blends with the wing geometry to minimise interference. It could of course act as a straightforward extension of the wing, but this would increase the bending moment and require a stronger (and heavier) wing structure to support it. Winglets of this design typically yield a reduction in induced drag of around 3%. They also allow the aircraft to move more freely within the limits of taxiways and aprons on the ground.
Conclusion
Like lift, drag is an aerodynamic force that influences the aircraft’s behaviour but is harder to model. The theory can’t accurately predict, for example, where the air flow over the wing will separate, nor account in detail for the effects of turbulence in the boundary layer. So designers carry out wind tunnel measurements and full-scale flight tests to back up their forecasts, and there is a growing trend towards computer simulation, which, with the development of more powerful digital computers, seems likely to take over the burden of detailed analysis. For the time being, however, analytical methods continue to be useful, especially during the early stages of the design process. A theory gives the analyst a sense of direction: it may not be accurate, but it points the way to improving a design concept through a landscape of possibilities, some of which might be advantageous and some not. At least, this has been the position until now. Artificial intelligence might eventually replace analytical methods and do a better job. We’ll leave the matter there, and in the next two Sections press on with high-speed aerodynamics before turning to more practical aspects of aircraft behaviour.
Appendix: The Reynolds number scaling problem
A wind tunnel can give a useful estimate of the drag incurred by a small-scale model of an aircraft. But as previously mentioned in Section F1817, it may not be possible to scale up the result to the full-sized vehicle unless there is ‘dynamic similarity’ between the two. The first requirement is that the two Mach numbers should be the same, in other words the velocity of the airflow in the tunnel must equal the velocity of the full-size aircraft in flight. For an aircraft travelling at well below the speed of sound, in practice it is sufficient that the air flow in the wind tunnel isn’t moving fast enough to set up any shock waves, which would change the nature of the flow pattern, so for the moment we can ignore this requirement and move on the second, which is that the Reynolds numbers must be the same. You’ll recall that the Reynolds number \({\rm Re}\) for a moving body is given by
(11)
\[\begin{equation} Re\; =\; \frac{\rho Vl}{\mu } \end{equation}\]where \(l\) is a reference dimension indicating the size of the body concerned (here we can take it to be the wingspan), and \(\mu\) is the dynamic viscosity of air in the surrounding flow field. If we use the subscript \(m\) for the model and \(p\) for the prototype, the Reynolds number similarity condition can be written as:
(12)
\[\begin{equation} \frac{\rho _{m} V_{m} l_{m} }{\mu _{m} } \; =\; \frac{\rho _{p} V_{p} l_{p} }{\mu _{p} } \end{equation}\]Suppose the physical characteristics of the air in the wind tunnel are the same as those in the atmosphere through which the prototype is moving, in other words, the air density is the same and the viscosity is the same. Then to meet the Reynolds number condition, this condition simplifies to:
(13)
\[\begin{equation} V_{m} l_{m} \; =\; V_{p} l_{p} \end{equation}\]In other words, the size of the model times the wind tunnel velocity must equal the size of the prototype body times its velocity through the atmosphere. So if we want to use a 1/20 scale model, the air in the wind tunnel must be moving twenty times faster than the full-size aircraft, and this is not usually possible. The investigator can get closer to the target by pressurising the wind tunnel to increase the air density, or by cooling the air to reduce the viscosity, both of which have the effect of increasing the Reynolds number for the model. One can also ‘trip’ the boundary layer to change its character, making the flow turbulent at a relatively low speed when it would normally remain laminar. Further details can be found in the aerodynamics textbooks, for example [1], together with specialist publications such as [13].