A.1615
High speed aerodynamics
Not long ago, I was walking along a country lane near my home. Ahead was a stile that led into the adjoining field, and on the other side of the hedgerow, insects were humming in the afternoon sun. I climbed the stile and stopped to watch, but was startled by an object heading towards me along the hedgerow only a few feet from the ground. It was small and moving fast. At the last moment it veered away with a flick of its wings, turned back towards the far end of the field, and began another circuit. It was a swallow. Others came along the same route, twisting and turning to catch the insects. They made no sound. I could not feel the downdraught nor hear the beat of their wings above the rustle of the breeze. But afterwards, it occurred to me that a bird must disturb the atmosphere, creating a pressure rise in front. You can see this in the pattern of flow around a moving body as predicted by potential flow theory.
Figure 1

figure 1 shows how the streamlines begin to part some distance ahead under the influence of the high pressure at the stagnation point. Evidently, for a swallow flying at 60 km per hour, the pressure rise is small, but it raises an interesting question: how is it communicated to the atmosphere ahead, and how quickly does the ‘signal’ travel?
Compressible flow
The molecules in the air are not packed tightly together as they would be in a solid material. They are moving about in different directions at speeds averaging in the region of 500 m s\({}^{-1}\), and although they occasionally bump into one another, for most of the time they are not in contact at all. Any pressure change is signalled by random collisions with their neighbours. So when a swallow – or a moving vehicle – pushes the air aside, the displacement takes place through a chain reaction among the molecules in the region ahead. The process takes time, because the pressure ‘signal’ cannot travel faster than the molecules that are carrying it.
Sound and motion
A sound wave is an interesting example. The sounds we hear are pressure changes transmitted through the air. In physical terms, they are no different from the pressure changes propagated ahead of a moving body, but they are much less intense. And we experience examples of the delay in sound transmission in everyday life, for example, the time lapse between a flash of lightning and the sound of thunder, which is about 3 seconds for every kilometre of distance between you and the lightning strike. The delay happens because in any medium, sound waves travel at a finite speed, which at sea level in a temperate climate is about 340 m s\({}^{-1}\). It’s called the speed of sound, which here we’ll denote by the symbol \(c\). Compared with the speed of sound through a liquid or solid, this is relatively low. Its value is determined by the temperature of the air, and it falls with increasing altitude.
The finite speed of sound reveals a fundamental shortcoming in potential flow theory. The theory assumes that the density of the air is constant throughout, whereas in reality, it must vary a little when a pressure change is communicated through the atmosphere. For objects moving at modest speeds in non-viscous irrotational flow, the pressure change is sufficiently small to be ignored.
Pressure
Now we can return to the question of a moving body. When travelling at speed, a vehicle stirs the atmosphere more vigorously than does a sound wave, and temporarily alters the pressure of the air around it. This is true for a body of any size or shape, and to illustrate what happens we’ll take the two-dimensional circular cylinder as an example because mathematically, for a frictionless fluid in irrotational flow, the pattern of streamlines takes on a relatively simple form.
Figure 2

figure 2 shows the cylinder in cross-section together with the flow pattern around it. Normally, we would consider the body as stationary and plot the motion of fluid parcels as streamlines, but here, we picture the flow differently. The cylinder is moving from right to left within a stationary flow field, so we are seeing how it disturbs different air parcels that are spaced at regular intervals across a rectangular grid. Attached to each air parcel is an arrow indicating the direction in which it is moving, and the length of the arrow indicates its velocity relative to a stationary observer (and not, as is usually the case, relative to the moving body). You can see that the highest speeds occur (a) immediately in front of and behind the moving body, and (b) along either side.
Here, we’re particularly interested in what happens in front. The air parcels immediately ahead of the nose are carried along momentarily at the same speed as the vehicle itself, but the forward component of this speed declines as they divide and turn around either side to fill in the space left behind. To propel them forward there must be a pressure gradient – as the nose approaches, each air parcel must feel a rise in pressure that pushes it out of the way.
Compressibility
How does one gauge the ‘compressibility’ of a substance? Aerodynamicists use a specific measure: denoted by \(\tau\), it is the fractional change in volume that results from a unit change in pressure:
(1)
\[\begin{equation} \tau \; =\; -\frac{1}{v} \frac{dv}{dp} \end{equation}\]where \(v\) is the volume and \(p\) is the pressure. Its value depends on the thermodynamic processes taking place in the fluid stream. In high-speed aerodynamics, it is usually assumed that the flow is isentropic – no heat is added to or taken away from the air parcels in the surrounding flow field. In this case, the compressibility is denoted by \({}_{\tau _{s} }\) and its value for air is around 0.71 atmospheres or 101 kN m\({}^{-2}\). This is quite large compared with the equivalent value for a liquid, meaning that air is more springy so one can squeeze it into a small space. But when it’s not forced into a container, the density of the atmosphere around us changes very little. You can push it quite vigorously and it simply moves out of the way, so when a vehicle passes through, the air resists being compressed – nothing happens unless the vehicle is moving fast. In the aviation world, the change in density first became apparent during the 1930s, when it began to affect the flow around the wings of powerful fighter aircraft. How fast must an aircraft travel for this to happen? Aerodynamicists usually measure the speed \(V\) in terms of a dimensionless parameter, the Mach number. It’s named after the German physicist Ernst Mach (1838-1916), who experimented with high-speed aerodynamic phenomena in the laboratory, publishing his results as long ago as 1887. The Mach number expresses the speed of a moving body as a fraction of the speed of sound \(c\):
(2)
\[\begin{equation} {\rm Ma}\; {\rm =}\; \frac{V}{c} \end{equation}\]As a practical guide, aerodynamicists consider the atmosphere as incompressible until the speed of the aircraft reaches Mach 0.3. At this speed, in certain places around the wing surface, the molecules tend to bunch together so the density increases significantly. The flow pattern changes, and locally, the temperature of the air parcels will rise. It’s changes of this kind that distinguish compressible flow from the classical model, in which the physical properties of the fluid remain fixed throughout the flow field.
Mach wave
We saw earlier how the air parcels in front of a body are pushed aside when it is moving at a relatively low speed. They move aside because the pressure rises in the region between the air parcels and the front of the moving body, and we want to know how fast this pressure ‘signal’ is travelling. Its speed can’t be infinite, but it must be faster than the moving body itself. To figure out its value, we must turn to a related phenomenon: sound waves. Imagine our moving body is small enough to be represented as single point in three-dimensional space, but it makes a noise that can be heard from some distance away. Sound waves are pressure fronts but they are very weak compared with the ones that push air aside in front of the moving body.
Figure 3

In figure 3, they are represented by the blue circles, each circle expanding at the speed of sound \(c\) into the surrounding air. In fact, they are really spherical waves viewed from the side. At the top of the Figure, the body is shown standing still. In the diagram below, it is travelling slowly from right to left, emitting sound waves at regular intervals en route. Since the waves are moving at finite speed, the circles begin to close up.
Now imagine the body travelling at the speed of sound. In the next diagram we see that it keeps pace with the front of each pressure front as it is emitted, so the fronts are concentrated into a narrow band that crosses its path at right-angles. Ahead of this band is a zone of silence – no-one in this zone can hear the body coming. Finally, a further increase in velocity results in the circles overlapping as shown in the diagram at the bottom. The pressure fronts are now concentrated on two straight lines inclined at an angle \(\mu\) to the direction of motion. More correctly, the straight lines trace the outline of a conical wave. It is called a Mach wave,and the angle \(\mu\) is called the Mach angle. It is easy to show that its value is given by [3]:
(3)
\[\begin{equation} \sin \mu \; =\; \frac{1}{{\rm Ma}} \end{equation}\]so that as the Mach number increases, the angle of the wave cone decreases.
Figure 4
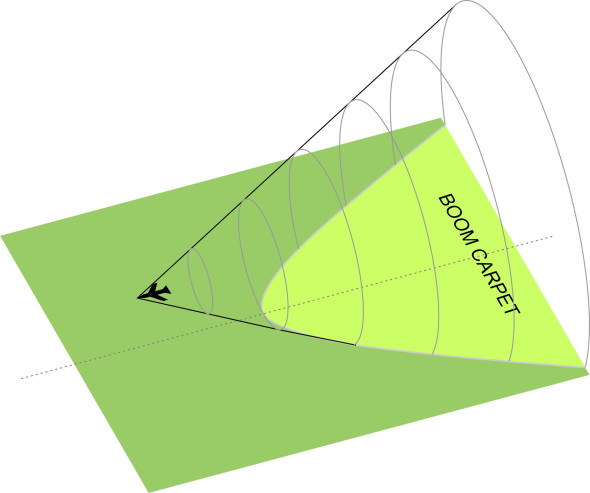
figure 4 shows how the cone intersects the earth’s surface. The area that it traces out is referred to as the ‘boom carpet’. If you happen to be standing at a point on the ground in the path of an aircraft travelling at supersonic speed, you’ll hear nothing while it passes overhead, then a supersonic ‘boom’ indicating a spike in the air pressure with the arrival of the wave. The strength of the spike declines with distance from the source (in fact, the strength of any such signal declines as the inverse square of radius), so that for an observer on the ground, the boom is less intrusive if the aircraft happens to be flying at high altitude. It produces a momentary increase in pressure of the order of 100 pascals, not enough to damage the observer’s hearing [14]. Sometimes, owing to conditions in different layers of the earth’s atmosphere, the wave cone changes shape behind the aircraft and does not reach the ground at all.
Speed regimes
To understand how aircraft behave, it is customary to break down the range of possible vehicle speeds into four regimes.
Figure 5
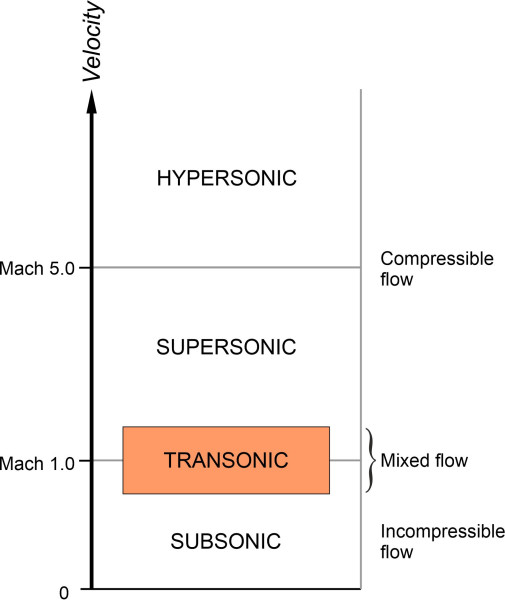
In figure 5, they are arranged in a column with the subsonic regime at the bottom. This corresponds to the range of speeds between zero and Mach 1.0, the speeds at which most vehicles travel. At the top lies the hypersonic regime, which extends from Mach 5.0 upwards. Very few vehicles travel at speeds within this range, mostly space vehicles re-entering the earth’s atmosphere from orbit.
The shaded rectangle represents the transonic regime, an intermediate range that spans across a different range for different aircraft, overlapping both the subsonic and the supersonic regimes. Here, the air flow over some parts of the aircraft is supersonic while the air flow over other parts remains subsonic, and the behaviour of aircraft cannot easily be predicted in terms of an analytical model. Somewhere within this range is a particular speed known as the drag divergence speed, denoted by \({}_{{\rm Ma}_{DIV} }\). When an aircraft accelerates through the drag divergence speed, the drag rises sharply and the lift falls. In addition, shock waves oscillate back and forth over the wings and cause buffeting, so the aircraft may become difficult to control. Not surprisingly, most aircraft are designed to operate at speeds below this threshold.
When developing an aircraft to fly at supersonic speeds, one of the designer’s main tasks is to estimate the air pressures acting on the wings, by setting up a system of equations and solving them to predict the fluid motion at different points in the flow field. But as you might expect, the flow pattern in the supersonic regime is very different from that in the subsonic regime, and this is reflected in the mathematics. In the subsonic regime, the density of the air is assumed constant and there are essentially two unknowns: velocity and pressure, so we need two sets of equations to model what is going on. They are (a) continuity and (b) momentum, and we met them earlier in Section F1919.
But in the supersonic regime, the air is compressible. The density becomes a third variable and the temperature a fourth, because when an air parcel moves from place to place within the flow field, its temperature will change as it compresses or expands. Moreover, friction losses cause some of the kinetic energy of the fluid parcels to be converted into heat, some of which transfers to the body surface [1] [2]. Hence we must add two variables to the list of unknowns: density, and temperature. Consequently there are two new sets of equations: the energy equation, and the gas equation of state. They can’t be solved analytically, but we can gain useful insight into the machine’s behaviour by picturing the evolution of shock waves over the body surface and working out what happens to the air flow between them.
Shock waves
When a body travels through the atmosphere at subsonic speed, the air parcels in its path begin to move out of the way before it arrives. Their movements are driven by pressure changes – signals if you like - that are more powerful than those that carry sound waves, but they are governed by the same rules and move at the same speed. However, the signals don’t arrive in time if the aircraft is travelling faster than the speed of sound. Rather than moving smoothly aside, the air parcels hold their position until jolted by a discontinuous pressure rise called a shock wave. You’ll find a brief introduction to shock waves in Section F1816; here, we’ll look more closely at the geometry.
Shock wave formation
In supersonic flight, shock waves arise on various parts of the body surface or in the flow field nearby. They take on different forms in different places. We’ll start with oblique shock waves, which occur on parts of the surface that face towards the oncoming stream and deflect the flow from its existing course. For the time being we’ll concentrate on the wing, which we assume has a very simple shape whose cross-section consists entirely of straight lines. This is not as strange as it might seem. We usually think of a fast-moving vehicle as streamlined with a smoothly curved body. But at very high speeds, the rules change. As will be explained later, two flat surfaces joined together at a sharp corner may perform just as well as a smoothly curved one.
Figure 6
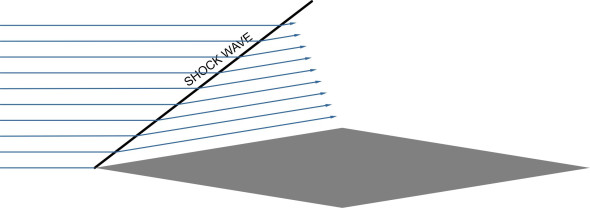
A good example of this is the double-wedge profile shown in figure 6. We’ll assume it is symmetrical about the chord line and moving at zero angle of attack. At the leading edge, the angle of the upper surface relative to the oncoming flow is denoted by \(\theta\). Whenever a supersonic air stream meets a surface that forces it to move aside, the air parcels pile up into a shock wave and change direction at the last moment. In this case, the same happens on the lower surface, where the flow pattern is a mirror image of what is happening above. The result is two shock waves that together form a ‘V’ pattern centred on the nose. Let’s focus on the upper surface and see what happens to the air parcels as they pass through the shock wave: downstream, they continue to move parallel to the inclined surface. You can see that the streamlines are now closer together, but this doesn’t mean the parcels are moving faster as it would in the case of subsonic flow. In fact their speed has fallen, and the spacing is smaller because the fluid density has increased. Also, the pressure and temperature have risen. Interestingly, the flow pattern in this region is uniform, so that the values of each of the four quantities speed, pressure, density, and temperature, are constant. It follows that the pressure imposed on the wing surface is uniform, and in this respect, the flow pattern simpler than it is in subsonic flow, where the pressure applied to the wing varies continuously from place to place around the aerofoil perimeter.
Oblique shock waves occur at the trailing edge too, where the flow over the upper surface and the flow underneath converge. At this point, both flows are forced to change direction, and they form shock waves in V-shaped pattern like the one at the leading edge. However, the air flow downstream of this second ‘V’ does not affect the aerofoil, so we can ignore it for the time being and return to what happens at the leading edge. On the upper surface, the angle \(\beta\) of the shock wave relative to the flow immediately upstream is a key variable, whose value must be determined in order to work out the pressure that the air parcels exert on the wing surface. Its value is linked to those of three other parameters: the first two are the angle of deflection \(\theta\), and the Mach number \({\rm Ma}_{1}\) of the upstream flow. The third parameter is the thermodynamic parameter \(\gamma\), the ratio of the specific heat of air at constant pressure to the specific heat at constant volume [4]. The derivation of the equation that links \(\beta\) to the three parameters is a little involved and we’ll just quote the result:
(4)
\[\begin{equation} \tan \theta \; =\; 2\cot \beta \left[\frac{{\rm Ma}_{1} {}^{2} \sin ^{2} \beta -1}{{\rm Ma}_{1} {}^{2} \left(\gamma +\cos 2\beta \right)+2} \right] \end{equation}\]This is not a very convenient formula. When designing a wing, given the speed \({\rm Ma}_{1}\) of the aircraft and the known value of the angle \(\theta\) for the slope of the leading edge of the wing, the aim is to predict the angle \(\beta\) of the shock wave that it generates. To find the answer, one must either solve the equation numerically, or read the result off a graph such as the one that appears in the NACA report of 1953 [13]. It is reproduced in many textbooks, for example [5].
Note that in the foregoing we’ve assumed that relative to the oncoming flow, the angle \(\theta\) is small. For angles above a certain size \(\theta _{max}\), the air parcels pile up and change direction ahead of the approaching body surface, so that the shock wave becomes ‘detached’ and equation 4 no longer applies. The value of \(\theta _{max}\) depends on the Mach number of the approaching flow. The shock wave in the flow approaching a blunt nose is always detached, with a curved profile as shown in figure 7.
Figure 7
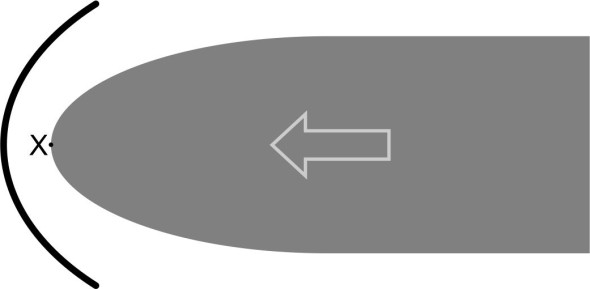
The point X marks the stagnation point. When the aircraft approaches supersonic speed, the shock wave begins to appear close to X, aligned at right-angles to the direction of motion. We call it a normal shock wave. In this region, the air parcels decelerate to subsonic speed, while pressure and the temperature increase. At speeds in the high subsonic range, the shock wave curves round the nose, diminishing in intensity on either side and merging into the large-scale Mach wave mentioned earlier. The high pressure aft of the shock wave applies a significantly increased drag force to the front of the aircraft, which is why supersonic aircraft are usually designed with a pointed nose.
It’s worth pausing for a moment to view what happens inside a typical shock wave. The wave itself is microscopically thin, of the order of 10\({}^{-4}\) mm, but it has a considerable effect on the air parcels passing through it. Each parcel experiences a rise in pressure, possibly by a factor of twenty or more, and as you would expect, the speed of the air parcel falls. On the downstream side, it usually remains supersonic, but at a lower value than upstream. As its speed falls, some of the parcel’s kinetic energy is converted into heat, which, together with the effects of compression, leads to a rise in temperature. This implies an irreversible loss of energy, which is dissipated into the surrounding atmosphere and into the body surface. As we’ll see later, the heat flow is potentially damaging for aircraft moving at very high speeds within the hypersonic range.
Expansion waves
When an air parcel passes through a shock wave, its pressure increases sharply. Sooner or later, its pressure must fall again, and return to that of the free stream in the aerofoil wake. Air parcels lose pressure by passing through expansion waves. These waves occur in places where the aerofoil surface is convex, for example, the crest of a double wedge as shown in figure 8.
Figure 8

If the crest has a sharp peak, the wave is called a Prandtl-Meyer expansion wave after the scientists who worked out the aerodynamic processes involved. Unlike the pressure change in a shock wave, the pressure fall is gradual, and takes place across a fan-shaped area through what is in effect an infinite number of pressure fronts. Within this area, the temperature and density fall too, but there is no dissipation of energy. The edges of the fan are located along Mach lines. The first subtends an angle \(\mu _{1}\) to the body surface upstream, and if we denote the flow velocity in the upstream zone by \(Ma_{1}\), then from equation 3, we find that:
(5)
\[\begin{equation} \mu _{1} ={\rm \; }arcsin\left(1/Ma_{1} \right) \end{equation}\]Similarly, the rearmost Mach line subtends an angle \(\mu_{2}\) to the body surface downstream where the flow velocity is \(Ma_{2}\), so that:
(6)
\[\begin{equation} \mu _{2} ={\rm \; }arcsin\left(1/Ma_{2} \right) \end{equation}\]Essentially therefore, the geometry of the expansion wave is fixed by the air velocities upstream and downstream.
Pressures on the wing surface
We’ve seen how the air parcels flowing around a wing profile at supersonic speed pass through a series of shock waves and expansion waves. Having examined the geometry of the waves, we can now begin to form a picture of the flow pattern between them. It will help us to look at an example.
Figure 9
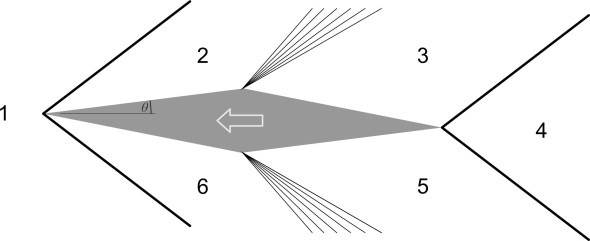
figure 9 shows a double-wedge aerofoil at a small angle of attack. Like a mosaic, the shock waves and expansion waves divide the flow field into six zones. In each zone, the flow is uniform and parallel to the wing surface. Crucially, the flow characteristics in any given zone are determined solely by what happens in the zone immediately upstream. Let’s focus on one particular shock wave (it doesn’t matter which), and denote the velocity in the upstream zone by \(Ma_{1}\) and the velocity in the downstream zone by \(Ma_{2}\). By solving equation 4 we can work out the angle \(\beta\) that the shock wave subtends on the upstream body surface in terms of the deflection angle \(\theta\). Then the pressure \(p_{2}\) downstream is linked to the pressure upstream \(p_{1}\) via the equation:
(7)
\[\begin{equation} \frac{p_{2} }{p_{1} } \; =\; 1+\left(\frac{2\gamma }{1+\gamma } \right)\left({\rm Ma}_{1} {}^{2} \sin ^{2} \beta -1\right) \end{equation}\]The derivation is set out in [4], but it’s rather lengthy and we won’t reproduce it here. You may have noticed from equation 7 that the pressure \(p_{2}\) on the downstream side depends only on the pressure \(p_{1}\) and the velocity \(Ma_{1}\) on the upstream side, together with \(\beta\), which in turn is determined by the deflection angle \(\theta\). The thermodynamic parameter \(\gamma\) is constant. In other words, we can determine the air pressure downstream from what we know about the flow upstream. No other information is needed.
So how about an expansion wave? The ratio of the upstream and downstream pressures is given by [7]:
(8)
\[\begin{equation} \frac{p_{2} }{p_{1} } \; =\; \left[\frac{1+\left(\frac{\gamma -1}{2} \right){\rm Ma}_{1} {}^{2} }{1+\left(\frac{\gamma -1}{2} \right){\rm Ma}_{2} {}^{2} } \right]^{\left(\frac{\gamma }{\gamma -1} \right)} \end{equation}\]The situation is more complicated in this case because the downstream velocity \(Ma_{2}\) appears on the right-hand side, and it’s one of the unknowns we are trying to estimate. It turns out, however, that the value of \(Ma_{2}\) can be deduced from the value of \(Ma_{1}\) via a procedure based on the Prandtl-Meyer function, the details for which are set out in [6]. Substitution of the result in equation 8 enables us to work out the pressure in the downstream zone, so that the flow parameters upstream of an expansion wave effectively determine the flow parameters downstream in the same way as they do for a shock wave. This leads us to a broad conclusion that we might have expected. In a supersonic flow field, information passes around the aerofoil in one direction only, along with the air parcels. Whatever lies ahead is irrelevant.
Wave drag
We have seen that when travelling at supersonic speeds, the flow over an aerofoil can be very different from the flow at subsonic speeds, where the motion of an air parcel in any part of the flow field is affected by – and in turn, affects – the motions of all the other air parcels. The sequential nature of the cause-and-effect process suggests a strategy for handling geometrically simple aerofoils, in which we treat the surrounding flow field as a mosaic that breaks down into separate zones, each lying between two waves. Conditions are uniform within each of the zones, and we can be solve them one by one, using equations equation 7 and equation 8 to determine the pressure acting on the aerofoil surface in each zone. Let’s return to figure 9 for a moment. Zone 1 represents the undisturbed free stream. It is moving relative to the aerofoil at the same speed \(V\) as the aircraft is moving through the atmosphere (albeit in the opposite direction), and \(p_{1}\) is identical to the pressure of the undisturbed stream. Downstream of the initial shock wave above the upper wing surface, the air parcels are deflected at an angle \(\theta\) to their original direction of motion, and the pressure rises to \(p_{2}\), which is uniform behind the shock wave. As can be seen from figure 10, the raised air pressure acts on a forward-facing body surface, and exerts a force whose component in the direction of the free stream acts against the motion of the aircraft – in other words, it contributes to drag.
Figure 10
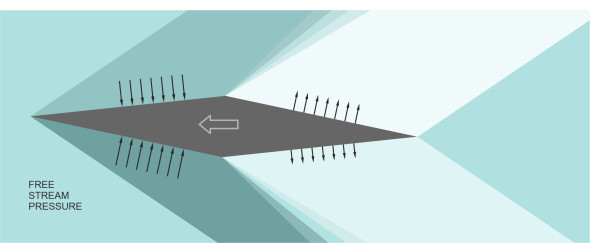
So what about the expansion wave between zones 2 and 3? As mentioned earlier in connection with the shock waves, the upstream and downstream air pressures \(p_{1}\) and \(p_{2}\) are both uniform, but now, \(p_{2}\) is negative relative the pressure in the free stream. Again, it exerts a force whose component in the direction of the free stream acts against the aircraft motion, and contributes to drag. In principle, we can repeat the process for the underside of the wing, and by working out the pressures acting on all the flat surface that make up the section profile, it’s not difficult to calculate the force components acting (a) against the direction of motion and (b) in the same direction as the direction of motion. The same strategy can be applied to any aerofoil made up of flat surfaces, and it turns out that for any such aerofoil treated in this way, the sum of the components in the first group outweighs the sum of the components in the second group to create a net drag. It’s called the wave drag, a phenomenon specific to aircraft flying at speeds high enough to generate supersonic flow on some or all of its body surfaces. Like other forms of drag, the wave drag can be expressed in terms of a drag coefficient, which for an aerofoil section is denoted by \(c_{d,w}\). There are other types of drag acting on the wing too, but in supersonic flight the balance between them changes. The viscous forces become less important and the skin friction coefficient decreases with increasing Ma, while the wave drag coefficient increases and makes up a large part of the total.
High-speed aerofoils
We’ve seen how it’s possible to quantify the air pressures acting on the faces of an idealised aerofoil such as a flat plate or a double wedge, using the formulae set out in equations equation 7 and equation 8. In principle, they enable the designer to work out numerical values for key aerodynamic parameters such as the coefficient of lift \(c_{l}\) and the coefficient of wave drag \(c_{d,w}\). However, we need something else, a tool that would help us understand what is going on, and how the aerodynamic performance of the aerofoil is affected by specific features such as the chord, thickness and camber. There’s no exact formula, but in what follows, we’ll describe an approximate method developed by the Swiss investigator Jacob Ackeret, who in 1921 joined Ludwig Prandtl’s laboratory at Göttingen and soon became a leading authority on supersonic flows. Then we’ll apply it to the geometrically simple aerofoils discussed earlier, extend it to more general profiles, and finish with a brief excursion into the hypersonic flow regime.
The Ackeret rule
Ackeret’s rule is an approximate formula that deals with the air pressures acting at different points on a slender aerofoil in supersonic flow at a small angle of attack. It is based on the perturbation velocity potential equation (the equation that Prandtl and Glauert used as the starting point for their ‘compressibility correction’). In fact, it’s a formula for the pressure coefficient\(c_{p}\) rather than the pressure itself; \(c_{p}\) is just a dimensionless number that functions in the much same way as a lift coefficient or a drag coefficient, except that it refers to a point on the aerofoil surface rather than the aerofoil as a whole. When multiplied by the quantity \(\tfrac{1}{2}\rho V^{2}\) it tells us the normal pressure acting at the point in question, measured relative to the free atmospheric pressure. Here, it takes on a surprisingly simple form. For any point on a forward-facing surface that subtends an angle \(\theta\) with the free stream, its value is given approximately by:
(9)
\[\begin{equation} c_{p} \; \sim \; \frac{2\theta }{\sqrt{{\rm Ma}^{2} -1} } \end{equation}\]where \(Ma\) is the speed of the undisturbed air flow. The derivation is set out in [11]. As you might expect, the pressure rises with \(\theta\). For an aft-facing surface, however, the angle \(\theta\) is interpreted as negative, so the pressure falls.
Idealised geometrical shapes
It’s not difficult to apply equation 9 to simple aerofoil shapes. By way of example, we’ll show the workings for the simplest profile of all: the flat plate.
Figure 11
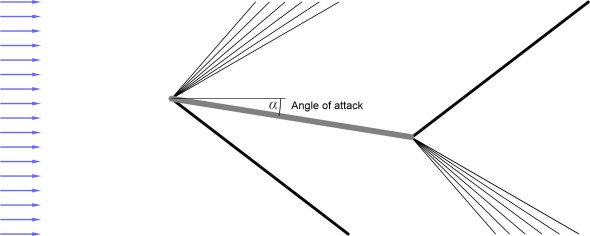
figure 11 shows a flat plate aerofoil moving at a supersonic velocity \(Ma\) and inclined at an angle of attack \(\alpha\). Underneath the lower surface there is a shock wave at the nose, and an expansion wave at the trailing edge. The lower surface forces the oncoming air downwards at an angle of deflection \(\theta\) that is equal to the angle of attack. The surface itself faces forwards, so the normal pressure underneath is greater than the free stream pressure. By contrast, the deflection angle for the upper surface is \(- \alpha\). There is an expansion wave above the nose, and a shock wave over the trailing edge. The upper surface faces aft, so the normal pressure over the top of the aerofoil is less than the free stream pressure. The combination of pressures on the two surfaces generates a net upward lift together with a net drag.
To quantify the contribution made by the lower surface, we substitute \(\alpha\) for \(\theta\) in equation 9, so the pressure coefficient for the lower surface becomes \({2\alpha /\sqrt{{\rm Ma}^{2} -1} }\). By definition, the resulting force on the underside of the plate is equal to the pressure coefficient times \(\tfrac{1}{2}\rho AV^{2}\) where \(\rho\) is the density of the atmosphere, \(A\) is the area of the plate, and \(V\) the aircraft velocity. It acts in an upward direction perpendicular to the plate. Similarly, the pressure coefficient for the upper surface is \({-2\alpha /\sqrt{{\rm Ma}^{2} -1} }\), and the resulting force on the upper side of the plate is equal to this pressure coefficient times \(\tfrac{1}{2}\rho AV^{2}\), acting in a downward direction perpendicular to the plate. The total force on the plate is \({\left(\tfrac{1}{2} \rho AV^{2} \right)4\alpha /\sqrt{{\rm Ma}^{2} -1} }\), and to get the lift \(L\), we multiply this force by \(cos\alpha\), thus:
(10)
\[\begin{equation} L\; =\; {\left(\tfrac{1}{2} \rho AV^{2} \right)4\alpha \cos \alpha /\sqrt{{\rm Ma}^{2} -1} } \end{equation}\]By definition, the section lift coefficient is given by
(11)
\[\begin{equation} c_{l} \; =\; {4\alpha \cos \alpha /\sqrt{{\rm Ma}^{2} -1} } \end{equation}\]and since for small \(\alpha\), \(cos\alpha\) is approximately equal to 1, this can be written
(12)
\[\begin{equation} c_{l} \; \sim \; {4\alpha /\sqrt{{\rm Ma}^{2} -1} } \end{equation}\]By a similar process, we can work out the wave drag force as the horizontal component of the total pressure force acting on the two surfaces, to get
(13)
\[\begin{equation} c_{d,w} \; =\; {4\alpha \sin \alpha /\sqrt{{\rm Ma}^{2} -1} } \end{equation}\]which for small \(\alpha\) can be written
(14)
\[\begin{equation} c_{d,w} \; \sim \; {4\alpha ^{2} /\sqrt{{\rm Ma}^{2} -1} } \end{equation}\]Now for the double wedge aerofoil. As shown earlier in figure 10, in the zones of uniform flow between the shock- and expansion waves, we find a positive pressure on the forward-facing surfaces, and a negative one on the aft-facing surfaces, both of which contribute to drag. Let \(c\) be the chord and \(t\) the thickness of the aerofoil at the point of maximum depth. Then using the same method as for the flat plate, it can be shown that the section lift and wave drag coefficients are:
(15)
\[\begin{equation} c_{l} \; =\; \frac{4\alpha }{\sqrt{{\rm Ma}^{2} -1} } \end{equation}\](16)
\[\begin{equation} c_{d,w} \; =\; \frac{4}{\sqrt{{\rm Ma}^{2} -1} } \left[\alpha ^{2} +\left(\frac{t}{c} \right)^{2} \right] \end{equation}\]You can see that the lift coefficient has the same value as the lift coefficient for a flat plate: this result holds approximately for all thin aerofoils at low angles of attack. However, the wave drag coefficient is higher, because of the finite thickness.
At first sight, the double wedge seems an unlikely candidate for an aerofoil cross-section. In general, you would expect a high-speed vehicle to be ‘streamlined’, with smoothly curved upper and lower surfaces. However, the suction pressure acting on the upper surface of a conventional wing peaks at a maximum between the leading edge and mid-chord, and falls thereafter, so within the boundary layer, there is an adverse pressure gradient across the latter part of the wing. As shown in Figure 20 in Section A1815, this is the case for a variety of profiles including the supercritical aerofoil. Air parcels travelling over the upper surface are hampered by friction and against a rising pressure gradient, will tend to separate before they reach the trailing edge. How does the double-wedge compare? Under the same conditions, one might expect the sharp peak at the crest to cause problems, but at supersonic speed, there is a difference: the pressure gradient is favourable. As figure 10 makes clear, there is positive pressure ahead of the crest, and negative pressure aft, a combination that propels the air parcels in the boundary layer towards the trailing edge so they are less likely to separate.
The favourable pressure gradient is not specifically a property of the double wedge. It reflects the act that in supersonic flow, a convex upper surface can be divided into two parts: the part that faces forward and part that faces aft. The aft-facing part is always the part nearest the trailing edge, and at supersonic speed, it generates a negative pressure. This is true of many if not most aerofoil profiles, so let’s look at another example, the bi-convex aerofoil as shown in figure 12.
Figure 12
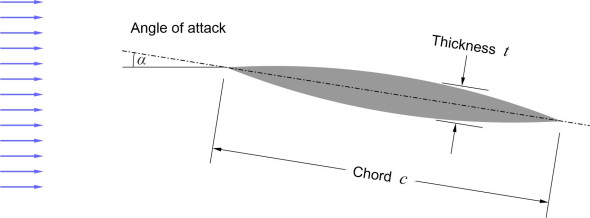
Both the upper and lower surfaces are arcs of a circle. We’ll assume the profile is symmetrical about the chord line. If so, the values of the lift coefficients for the bi-convex aerofoil and the double-wedge aerofoil are equal. This doesn’t apply, however, to the wave drag coefficients: the value for the bi-convex aerofoil is a little higher:
(17)
\[\begin{equation} c_{d,w} \; =\; \frac{4}{\sqrt{{\rm Ma}^{2} -1} } \left[\alpha ^{2} +\tfrac{4}{3} \left(\frac{t}{c} \right)^{2} \right] \end{equation}\]On the other hand, the curved surfaces of the bi-convex aerofoil generate more lift at subsonic speeds, and provide a greater margin of safety during low-speed manoeuvres.
Practical aerofoils
In fact, most supersonic aircraft have wings whose cross-section is a compromise that takes into account various other needs such as structural stiffness and storage capacity for landing gear and fuel tanks. In general, supersonic aerofoils are thin and slender with sharp leading and trailing edges. Provided the surfaces are smooth, the precise shape of the upper and lower surfaces does not seem to be critical. However, supersonic aerofoils are not very efficient, in the sense that the maximum ratio of lift to drag is only about half the value that is typical of subsonic ones [12]. Moreover, a sharp leading edge is prone to separation at a high angle of attack during take-off and landing. This is why the wings of high-speed aircraft need high-lift devices: flaps and slats that effectively change the profile of the wing for take-off and landing.
For these more general aerofoil shapes, Ackeret’s rule still applies. Starting from equation 9, Ackeret was able to obtain expressions for the lift coefficient and the wave drag coefficient as follows [8]:
(18)
\[\begin{equation} c_{l} \; \sim \; \frac{4\alpha }{\sqrt{{\rm Ma}^{2} -1} } \end{equation}\](19)
\[\begin{equation} c_{d,w} \; \sim \; \frac{4\left(\alpha ^{2} +g_{c} {}^{2} +g_{t} {}^{2} \right)}{\sqrt{{\rm Ma}^{2} -1} } \end{equation}\]where \(g_{c}\) and \(g_{t}\) are respectively functions of the aerofoil camber and thickness. Notably, the lift coefficient decreases with increasing speed, and provided the aerofoil is slender and inclined at a low angle of attack, its value is almost independent of the aerofoil shape. In fact, the lift coefficient given by equation 18 takes the same value as that mentioned earlier for a flate plate in equation 12. Note that the drag coefficient refers specifically to wave drag, and doesn’t include skin friction.
The hypersonic regime
In principle, the equations that govern the air flow over the wings in hypersonic flight are the same as those for supersonic flight. However, you’ll have observed earlier from figure 3 that as the speed of an aircraft rises, the angle of the Mach wave falls, and although it’s not obvious from equation 4, the oblique shock waves incline further aft as well, so that in the hypersonic regime, they lie almost flat against the body surface. Here, two factors play an increasingly important role. The first is heat. In this speed regime, heat is generated (a) by friction between the boundary layer and the body surface, and (b) within the shock wave, where violent compression produces a sharp rise in temperature. Both heat sources are concentrated in the narrow wedge between the shock wave and the wing surface, where the temperature rise lowers the density and raises the viscosity of the air parcels. In turn, this may affect the flow pattern together with the aerodynamic forces acting on the wing. And close to the stagnation point, the air molecules may react chemically with the wing surface and cause significant damage [15].
The second main factor has to do with the boundary layer. Its thickness increases as the square of the Mach number, so the boundary layer and shock wave begin to overlap, and where they overlap, they interact. For example, at a sharp nose such as the leading edge of a flat plate, the boundary layer deflects the oncoming flow and causes the wave to curve around the leading edge as shown in figure 13. This strengthens the shock wave and increases the pressure on the plate, which further increases the friction heating effect of the body surface at the leading edge.
Figure 13

As is the case with supersonic flows, analysing the flow is a complex task best carried out through computer simulation, but for speeds in the hypersonic regime, rough estimates of the lift and drag coefficients can be derived from Newton’s sine-squared law. Newton proposed this formula long before the molecular nature of gases and liquids was properly understood. He imagined that the air molecules are spaced widely apart and move independently like tiny grains of sand. When they collide with a moving body, they change direction, being deflected parallel to the body surface, and by transferring the component of momentum perpendicular to the body surface, they generate a steady pressure. For most fluid flows, this is not actually the case: the molecules interact with one another and the outcome is different, but at very high speeds, Newton’s model works quite well, in the sense that it gives a useful estimate of the pressure coefficient for the under-surface of a slender aerofoil over a range of speeds within the hypersonic regime [15]:
(20)
\[\begin{equation} c_{p} \; \sim \; 2\sin ^{2} \alpha \end{equation}\]By contrast, the upper surface is sheltered from molecular impacts and makes no contribution to wave drag at all. Then it can be shown that the section lift and wave drag coefficients are [10]:
(21)
\[\begin{equation} c_{l} \; =\; 2\sin ^{2} \alpha \cos \alpha \end{equation}\](22)
\[\begin{equation} c_{d,w} \; =\; 2\sin ^{3} \alpha \end{equation}\]Noticeably, these are much smaller than the equivalent values for supersonic flight set out earlier in equations equation 18 and equation 19, and they do not vary with the aircraft speed. At first glance this seems puzzling. Mathematically, the relationships that determine the shock wave angle are the same in both regimes, and one might expect, for example, the graph of \(c_{l}\) against Mach number for supersonic flow to merge smoothly with the corresponding curve for hypersonic flow as the Mach number tends to infinity.
Figure 14
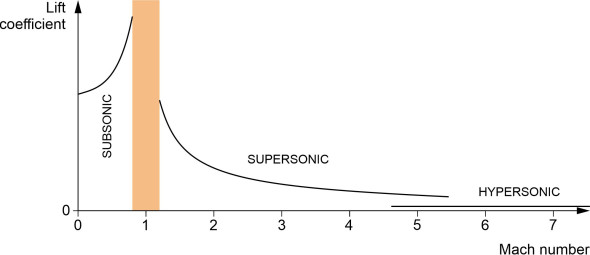
figure 14 shows the two curves for the case where the angle of attack is 2\({^\circ}\). Also shown for comparison is the curve for subsonic flow (we’ve assumed the lift coefficient is the same as that for a flat plate as derived in Section A1816, but here, it’s adjusted using the Prandtl-Glauert compressibility correction). When the curves are plotted together on the same graph, the discrepancy between the models for the supersonic regime and the hypersonic regime becomes clear. The key lies in the properties of air: at high Mach numbers, the shock waves lie flat on the body surface, the value of \(\gamma\) falls, and heating effects become more important. As a result, the air density changes and this affects the flow pattern.
Conclusion
As you walk around outdoors, all the birds and insects you see are moving at less than the speed of sound. With very rare exceptions, so are the aircraft. In broad terms, they all interact with their surroundings in the same way, re-directing the air parcels over a wide sphere, pushing them forward and to either side from some distance away, so the parcels encircle the moving body and take up new positions in its wake. By contrast, at supersonic speeds, the interaction is more sudden and severe. Shock waves form ahead of and around the vehicle, which compress the parcels and divert them abruptly around the body surface before they pass downstream into the wake. At hypersonic speeds, other factors emerge. Here, much of the lift comes from pressure underneath the wing, the opposite of what happens in subsonic flow. Aerodynamically, the wings are less efficient, generating less lift and more drag. In fact, the distinction between the wings and the fuselage begins to disappear, and heat becomes a serious problem. At this point, we’ll break off from our pursuit of aerodynamics as such, and turn to more practical aspects, in particular, the various aircraft configurations that have evolved over the decades in pursuit of high-speed flight.