A.0415
Flying the aircraft
Finally, we turn to managing the aircraft: how the pilot controls its motion through the atmosphere. We’ll start with the take-off, follow the aircraft’s progress through some basic manoeuvres en route, and finally see how it lands and comes to rest. We won’t learn how to fly an aeroplane but focus more on the forces involved together with the role of the contact patch between the wings and the air, and between the wheels and the ground. It turns out that flying an aircraft is a more complicated process than it looks – there is no direct parallel between controlling its path through the atmosphere and steering an automobile along the highway. And the take-off and landing processes make considerable demands – they are among the most difficult of manoeuvres that the pilot has to undertake.
Take-off and climb
Most flying machines start their journey from an airfield, and commercial jets need an airfield that has a runway with a prepared running surface. One of the problems with the take-off is that at some point along the runway, the pilot must decide whether the machine is performing well enough to climb safely away from the ground, or to abandon the process and brake to a halt instead.
The take-off process
When an aircraft takes off, it goes through three distinct phases as shown in figure 1. Assume that to begin with, the aircraft halted at the beginning of the runway. During the first phase, the aim is to get it rolling fast enough for the wings to lift it off the ground, together with an additional speed margin for safety. The pilot raises the engine power and releases the brakes. As the aircraft rolls forward it picks up speed until it reaches a critical value – the ‘decision speed’ \(V_{1}\). It is not a fixed quantity, but depends on the aerodynamic performance of the machine together with local conditions at the time, and is determined separately before each flight using a computer program. It allows among other things for the eventuality of an engine failure. If the speed is less than \(V_{1}\), in principle there is sufficient length of runway to stop and the pilot can abandon the attempt. Otherwise, the pilot must continue and attempt to take off. There are just a few seconds in which to make this decision, and in practice, data for abandoned take-offs during the 1990s suggests that many turned out to be unjustified, and owing to the small safety margins involved, there were many instances where the brakes caught fire, tyres blew out, or aircraft over-ran the runway [15].
Figure 1
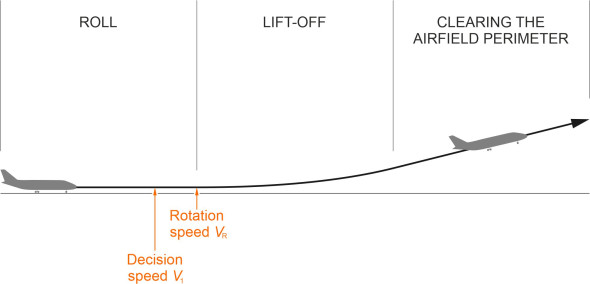
Assuming the process goes ahead, the plane will continue to gain speed until it reaches another critical value \(V_{R}\), the rotation speed. At this point, the pilot can raise the nose and increase the angle of attack until the lift exceeds the aircraft’s weight. At lift-off speed \(V_{LO}\) the wheels will leave the runway and the aircraft will continue with the second phase of the take-off and follow a curved trajectory into the air as shown in the Figure. As an example, the lift-off speed for the Boeing 777 is about 180 mph (290 km/h) [1]. Finally, it will rise at a steady speed \(V_{3}\) until it clears a regulation height (currently 35 feet in the US and the UK), at which point the take-off process is complete.
Climb
At low altitude, immediately after take-off the atmosphere is dense so the air resistance is high, and with a full fuel load the engine has to work hard to keep the plane aloft. The aim is therefore to reach an economic cruising altitude as soon as possible. So the pilot adjusts the aircraft trim and maintains a high level of engine thrust to maximise the climb rate: the height gained per unit time, which is usually not more than 5000 feet per minute or 1500 metres per minute.
Figure 2

On a long journey, it may be necessary to break the climb into a series of steps as shown in figure 2. This is because initially, the aircraft is carrying a heavy fuel load, and since the air higher up is too thin to support the aircraft’s weight, it may take some time for the engines to burn off enough fuel for it to achieve cruising height. As the aircraft rises in stages towards its goal, the climb rate falls, because in thin air the engines produce less power and the wings create less lift. Hence there is a limit to how high the machine can safely travel, which we discussed previously in Section A1215. It is known as the service ceiling, usually defined as the height at which the climb rate is reduced to 100 feet per minute [2].
Runway length
Clearly, the runway length is a critical parameter when planning a take-off. Taking off demands a longer runway than landing, because (as with any road vehicle) the vehicle cannot speed up as quickly as it can slow down. So let us take this opportunity to work out a formula for a safe runway length and pick out the variables that matter. It’s an involved process. The maths is not inherently difficult, it’s just there are many factors to be taken into account, and nowadays the analysis for any particular airfield is carried out by computer. Nevertheless, by making a couple of simplifying assumptions we can arrive at a useful result. We’ll follow broadly the logic put forward by [14]. Assume that the aircraft accelerates from a standing start propelled by a net horizontal force \(F\), and denote the acceleration by \(a\). We assume a is constant during the ‘roll’ phase while the wheels are still in contact with the ground. From the well-known constant acceleration formula it is not difficult to show that the distance travelled \(d\) when the aircraft reaches a speed \(V\) is given by
(1)
\[\begin{equation} d\; =\; V^{2} /2a \end{equation}\]Denote the distance to lift-off by \(d_{LO}\), and the speed at lift-off by \(V_{LO}\). Equation 1 tells us that
(2)
\[\begin{equation} d_{LO} \; =\; V_{LO} {}^{2} /2a \end{equation}\]Also, if the aircraft weight is \(W\) when expressed in force units, it follows that \(F={\rm \; }\left(W/g\right)a\) and therefore
(3)
\[\begin{equation} a\; =\; Fg/W \end{equation}\]Denote the wing area by \(S\), the air density by \(\rho\), and the maximum lift coefficient by \(C_{Lmax}\). If we assume that the aircraft leaves the ground when the lift balances the weight, by definition, the lift force is then equal to \(\frac{1}{2}\rho V_{LO} {}^{2} SC_{Lmax}\) and we have
(4)
\[\begin{equation} W\; =\; \frac{1}{2}\rho V_{LO} {}^{2} SC_{Lmax} \end{equation}\]Then by substituting \(2ad_{LO}\) for \(V_{LO} {}^{2}\) from equation 2, and substituting \(Fg/W\) for \(a\) from equation 3, after re-arranging, we get
(5)
\[\begin{equation} d_{LO} \; =\; \; \; W^{2} /\rho SC_{Lmax} F \end{equation}\]The net propulsive force \(F\) is just the engine thrust \(T\) minus the resistance arising from friction force on the tyres together with the rolling resistance. If we assume the resistance forces are small we can re-write equation 5 as
(6)
\[\begin{equation} d_{LO} \; \sim \; \; \; W^{2} /\rho SC_{Lmax} T \end{equation}\]In practice, allowances must be made for a possible engine failure and an abandoned take-off. Nevertheless, equation 6 is a useful indicator of the take-off distance required, and it tells that under the assumptions on which our calculations are based, it is particularly sensitive to two factors. First, it is proportional to the square of the aircraft weight. Heavy aircraft need a long runway. This explains perhaps why a Boeing 747 needs a runway of about 3 km compared with smaller jets that manage with a shorter length of between 1 and 2 km. The second factor relates to the air density \(\rho\). You can see that the quantity \(\rho\) appears explicitly in the denominator on the right-hand side of equation 6. But it is also the case that for a jet engine the thrust \(T\) is proportional to the air density \(\rho\), so that in effect, the expression on the right-hand side is inversely proportion to \(\rho ^{2}\). This implies that the length of the take-off run is inversely proportional to the square of the local air density. If the aircraft is taking off in warm weather, or from an airport located at a high altitude, \(d_{LO}\) may be significantly greater than expected.
Aerial manoeuvres
It’s not easy to describe in everyday language how a pilot flies an aircraft. There are three basic means of control in the cockpit (the control column, the rudder pedals, and the throttle), and during any particular manoeuvre, the pilot may adjust two or more of them simultaneously. The best we can do is focus on a simple turning manoeuvre and leave the rest to the reader’s imagination. Fortunately, to an experienced pilot, the actions come naturally.
Adjusting speed and height
When driving a car, if you want to speed up you press your foot harder on the throttle pedal: this increases fuel flow to the engine, which in turn delivers more power. The equivalent control in an aircraft is a throttle lever, but from the pilot’s point of view, its purpose is quite different. Increasing the power supplied by the engine will make the aircraft go faster in the short term, but the end result is an increase in the angle of attack, an increase in lift, and a change in the flight angle. The aircraft climbs. A similar paradox arises with the elevator control. If you pull the control column backwards, the immediate effect is to make the nose rise so the machine pitches upwards, but the change in angle of attack simultaneously generates more lift and drag, the result being that the aircraft slows down. Primarily, the elevators act as a speed control [9] that works by changing the angle of attack, while the throttle controls the climb angle and hence the rate of change in altitude.
Turning
Imagine you are driving a car along a country lane. Ahead of you is a right-hand bend. You turn the steering wheel clockwise for a while and the car swings around. The tyres supply a transverse force that holds it on a curved path until the car reaches the end of the curve, when you return the steering wheel to its central position. But handling an aircraft is a different matter. There is no steering wheel as such, and simply pointing the machine to the left or right doesn’t work. What holds the aircraft on a curved path is extra lift from the wings, tilted at an angle as shown in figure 3 so there is a significant lift component that acts towards the centre of the curve.
Figure 3

Let’s look at the events that take place during the turning process. Picture a turn to starboard starting from straight and level flight. To tilt the aircraft, the pilot first rolls or ‘banks’ the aircraft to starboard using the ailerons. Immediately, we run into a problem. In raising the left wing, the left aileron creates extra drag, which tends to pull the wing aft and swing the aircraft in the wrong direction (figure 4).
Figure 4

Once the aircraft is rolled into position, the aileron angle can be reduced - otherwise it will continue to roll and turn right over – but given that most aircraft have dihedral to combat unwanted roll, it may still be necessary to apply some aileron displacement to hold it in its banked position, and at the same time to apply right rudder to counteract the adverse yaw. In the banked position, there is also a tendency to sideslip to the right (we noted this earlier in Section A0418) in which case the aircraft rotates to the right about its vertical axis too. In effect, it is starting to turn of its own accord. However, it is also losing height, so the pilot applies the elevators to pitch the nose upwards (figure 5). Put simply, in our scenario the pilot has used three controls (ailerons, rudder and elevators) to execute a turn. In practice however, many modern aircraft are designed to minimise adverse yaw, so they can be turned without any contribution from the rudder.
Figure 5

Manoeuvrability
Figure 6
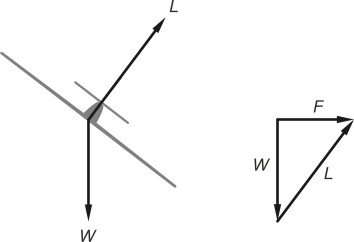
Earlier in figure 3 we saw an aircraft banked to starboard. It is following a curve of constant radius along a level path with zero sideslip, an idealised example of a starboard turn. Figure 6 shows the main forces involved: the aircraft’s weight \(Wg\) acting vertically downwards, and the lift \(L\) perpendicular to the wings. It is clear that the lift force must be greater than the aircraft’s weight, and the more steeply it is banked, the greater the lift needed to carry out the turn. The force \(F\) is the horizontal component of the lift acting towards the curve centre: it supplies the centripetal force needed to hold it on a curved path, and from the triangle of forces:
(7)
\[\begin{equation} F^{2} \; \; =\; \; L^{2} - W^{2} \end{equation}\]But by definition the centripetal force \(F\) must equal \(WV^{2} /rg\): after substituting in equation 7 and re-arranging, we get
(8)
\[\begin{equation} r\; \; =\; \; WV^{2} /g\left(L^{2} - W^{2} \right)^{1/2} \end{equation}\]Under any given flight conditions, we know that the lift depends on the aircraft speed \(V\), the lift coefficient \(C_{L}\), and the wing area \(S\). The general lift formula was set out earlier as eq 15 in Section A1810. Here we’ll use the notation \(S\) for wing area rather than \(A\), so that
(9)
\[\begin{equation} L\quad =\quad \frac{1}{2} \rho V^{2} SC_{L} \end{equation}\]Substituting for \(L\) in equation 8 and simplifying, we get:
(10)
\[\begin{equation} r\quad =\quad \frac{{{V}^{2}}}{g\sqrt{{{\left( \frac{\rho {{V}^{2}}S{{C}_{L}}}{2W} \right)}^{2}}-1}} \end{equation}\]It’s a laborious process, but by setting all the quantities except \(V\) in equation 10 as constants, one can show that over the whole range of possible speeds, \(r\) falls with increasing \(V\). Putting it the other way round, to make a tight turn, the speed must increase. But what about the rate of turn? To complete a full circle of radius \(r\) when travelling at speed \(V\), the aircraft must travel a distance \(2\pi r\) and the complete rotation will take time \(2\pi r/V\), so the rate of rotation is \(2\pi\) radians divided by \(2\pi r/V\), which is just \(V/r\).
Since the quantity \(V/r\) increases with \(V\), it follows that to turn quickly, again the speed must increase. This is almost the opposite of what happens with a car or a truck – when you want to make a sharp turn you slow down, otherwise the vehicle will skid. In an aircraft, the centripetal force needed to make the turn comes from the lift, so you speed up. There’s a limit of course, because the g-forces acting on the pilot increase too, and the wings come under greater stress.
So what are the aerodynamic qualities an aircraft needs if it’s to carry out demanding manoeuvres such as a tight turn? From equation 10 we see that the relevant parameters are the wing area \(S\) and the coefficient of lift \(C_{L}\). As \(S\) increases, the turn radius \(r\) falls, so a large wing area is an advantage. The same applies to the lift coefficient. Other things being equal, an aircraft will turn in a smaller space – and more quickly – if the wing area and coefficient of lift are large. The same applies to the air density \(\rho\), demonstrating as one might expect that any given aircraft is more manoeuvrable at low altitude than at high altitude. To summarise, the key to manoeuvrability is high lift.
Loss of control
Occasionally, for one reason or another the pilot of an aircraft loses control. Earlier in Section A0418 we mentioned the risk of spiral instability, in which the aerodynamic characteristics of an aircraft make it vulnerable to a kind of accelerated dive, in which it is sometimes difficult for the pilot to discern what is happening, and to take appropriate action. But the most common cause of loss-of-control accidents is the stall, in which the lift falls below the level needed to support the load acting on the wings.
The stall process
Under what circumstances might this happen? From equation 8 we saw how the lift depends on the velocity \(V\) and the lift coefficient \(C_{L}\). In straight and level flight, it must be sufficient to support the aircraft’s weight \(W\), the only load acting on the wings. In Section A1215 we showed that the stall speed \(V_{s}\) in this case is given by
(11)
\[\begin{equation} V_{S} \quad =\quad \sqrt{\frac{2W}{\rho SC_{L,\max } } } \end{equation}\]If the aircraft travels too slowly it will stall, so the nose drops suddenly and causes the angle of attack to rise. From Section A1815 we see that the lift coefficient for aerofoil increases with the angle of attack, but only up to a point. It falls again after reaching a peak at its maximum value \(C_{Lmax}\). The same applies to the lift coefficient \(C_{L}\) for the whole wing, the peak \(C_{Lmax}\) occurring typically at an angle of attack in the region of 15\({^\circ}\). So at this point, the lift falls further, making the situation difficult to recover. In the case where the aircraft is making a turn and the load on the wings is greater than \(W\), a similar formula applies, except that we replace \(W\) on the right-hand side by the total load. It’s clear therefore the stall speed increases during a turn, and unless the pilot applies extra power, a demanding manoeuvre can destabilise an aircraft even though it’s travelling well above the normal cruising speed. Spitfire test pilot Jeffrey Quill once wrote that ‘…in fighter engagements, inadvertent stalls are very frequent…’ [5].
In this section, for simplicity we’ll continue with the simpler case of straight and level flight. Broadly speaking, once a stall begins it can progress in either of two possible ways: either
- The aircraft ‘pancakes’, staying more-or-less level but sinking with increasing velocity, or
- One wing stalls before the other so that initially, the aircraft rolls to one side.
In either case, it is difficult for the pilot to keep control because the air is no longer flowing smoothly over the ailerons and elevator surfaces, and the control column may not have the intended effect. Case (b) is more common, but we’ll deal with case (a) first. In more severe cases, it may become a ‘deep stall’.
Deep stall
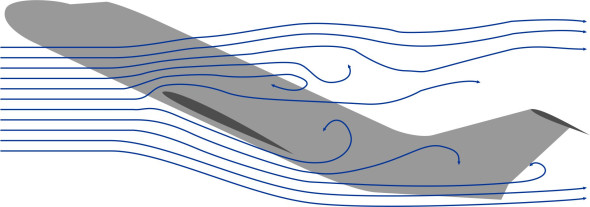
Normally when an aircraft begins to ‘pancake’ the centre of pressure moves aft and it tends to pitch nose-down. We might expect the pilot to rescue the situation by pulling the nose up, but this increases the angle of attack and will cause the speed to fall further, accentuating the problem. Instead, it is necessary to pitch the nose down, which reduces the angle of attack, and eventually helps the speed to recover. Clearly, you don’t want to stall close to the ground! And as previously discussed in Section A1410, if the tailplane is mounted high above the fuselage as shown in figure 7, the vortices from the wings and the wake from the fuselage interrupt the steady airflow over the elevators so they lose their effectiveness, and this has caused serious accidents in the past that led to the routine installation of automatic stall warning systems on commercial aircraft during the 1960s.
Figure 7
Stall and spin
In the second type of stall, one wing stalls before the other and causes the aircraft to roll. It is more common because the pattern of air flow over the two wings is rarely quite the same, so at any given moment, one wing is producing more lift than the other. The difference in lift may be caused by a gust of wind, a control action by the pilot, or a slight asymmetry in the wing surfaces, but it has a profound effect on the aerodynamic behaviour of the whole. Once the aircraft rolls, it sideslips and falls into a combined turning and diving motion that harder to correct. As the higher wing rises, the upward motion effectively reduces the angle of attack, which may cause it to unstall, so the lift coefficient rises. Also, the drag falls so the upper wing tends to speed up. As the stalled wing drops, the extra downward motion causes the angle of attack to increase, reducing the lift further and increasing the drag. The reduced drag on the upper wing together with the increased drag on the lower wing causes the aircraft to yaw towards the side of the falling wing, and at this point, the aircraft begins to ‘spin’ as shown in figure 8. The spin is now said to be ‘locked in’. It is not the same as a spiral dive, in which the aircraft is flying along a smooth curve, albeit one that progresses steeply towards the ground. Instead, the machine is rotating about a vertical axis relatively close to the centre of mass.
Figure 8

During the early days of flight before the dynamics of the motion were understood, getting out of a spin proved difficult for pilots. The natural reaction is to use the ailerons to counter the roll, but this only makes matters worse. There is now a well-rehearsed procedure that begins in the same way as the recovery from a symmetrical stall: to push the control column forward so the plane gathers speed. The second step is to use the rudder to stop the rotation. Once the aircraft is flying under control, albeit heading almost vertically downwards, the pilot can pull back on the control column to restore horizonal flight. According to one source, the first recorded recovery from a spin occurred in 1912 [12]. Even today, a light aircraft may lose as much as 1000 feet of altitude during the recovery operation. It is also possible to design the wing to minimise the likelihood of a stall by modifying parts of the cross-section. The aim is to ensure that initially, stalling begins close to the wing root rather than near the tip, which reduces the asymmetric forces that lock in the rotation. You can find more on this in [13].
Landing
‘Landing is the most difficult manoeuvre the pilot has to undertake’
When driving a car, you steer it carefully to avoid hitting the kerb or colliding with another vehicle coming in the opposite direction. Flying an aircraft is different. Once aloft, there is space all around, so the plane can deviate a little from its intended course. But conditions change towards the end of the flight, when much of this freedom disappears. The pilot aims for a specific target, a relatively narrow stretch of runway. Not only must the aircraft line up precisely with the runway axis, but it must make contact close to the beginning of the runway and its speed must be controlled within a narrow range, which means shedding a lot of energy. Some of it is kinetic energy associated with the aircraft’s weight and speed (most likely in the range 300 – 500 km/h), and some is potential energy arising from its altitude within the earth’s gravitational field. Much of the energy is dissipated in the form of turbulence in the aircraft wake, a small but significant proportion of which emerges as noise. The remainder is absorbed in braking. In principle, an aircraft needs less runway to land than it does to take off, but this depends on where the wheels first make contact.
Approach
It’s not our purpose here to go into all the technicalities, but once it begins its descent, an airliner may travel more than 150 km before it reaches the runway [16], much of it under Air Traffic Control. Procedures vary among commercial airports, but after it has descended to 5 000 feet, it will aim for a point about 20 km upwind, where it will turn towards the runway and prepare to land. After extending flaps and landing gear, it begins its final approach at a speed of around 250 km/h, taking about 5 minutes to reach the runway itself. There are several different systems for guiding aircraft to the point of touch-down. The first requirement is to ensure the aircraft approaches from the right direction. One of the challenges for the pilot is to keep precisely on the line of runway, possibly using sideslip to correct for lateral drift caused by the wind.
The world standard Instrumented Landing System approach provides guidance on the angle of descent, which is usually carried out at an angle of 3\({^\circ}\). This is vital for large jets, whose momentum makes it difficult for the pilot to adjust the aircraft’s trajectory at the last moment. Another hazard is wind shear above the runway, which we discussed earlier in Section A1918. It caused by a local downdraft that propels the wind radially outward at surface level, so that an aircraft may have to cope with sudden variations in airspeed near the point of touch-down.
Flare and touchdown
Figure 9

Towards the end of its approach, the aircraft is descending at a fixed rate per unit time, commonly around 3m/s. Close to the runway, this must fall to zero, otherwise there will be an unpleasant bump. The vertical momentum is dissipated by raising the nose to increase the angle of attack, and assisted by the ground effect, the pilot levels out in a curved trajectory to smooth the impact (figure 9). To provide a margin of error in judging the location of the point of touch-down, the speed is about 25% greater than the stalling speed. When a commercial aircraft lands, several events happen in quick succession. First, the main landing wheels make contact while the nosewheel is still in the air. The impact on the runway may be considerable: a single landing wheel of a large passenger jet can impose a load of 30 T on the surface [11]. On contact, the wheel begins to rotate, and it is moving fast. The landing speed of the giant A380 airliner is about 200 mph (320 km/h). For a large aircraft, the aim is to shed lift quickly so the vehicle’s weight transfers from the wings to the landing gear. To do this, large aircraft are equipped with spoilers that cause the air flow to separate over the wings. They also use reverse engine thrust to reduce the speed. The nose then drops so that all the wheels are in contact with the runway. This part of the landing is known as ‘free roll’. Once the wheels have developed the normal contact force needed to generate braking friction, the wheel brakes take over – and the nosewheel takes over the role of rudder in steering from side to side.
Braking
The brakes of an aircraft are used to slow it down to taxiing speed. The pilot needs to be aware of local conditions because the coefficient of friction varies with the weather and varies between airports. Values range from 0.95 for dry asphalt to 0.45 for smooth, wet concrete [6], and as with trucks and automobiles, it’s essential to control the friction force applied to each wheel. Otherwise, if it locks, the tyre could burn through the tread and blow out ‘in seconds’ [6]. Anti-lock brakes were originally developed during the 1940s by the US Westinghouse company and are standard on large aircraft today. Surprisingly, skidding in the wet causes more damage to the tyre than skidding in the dry, with super-heated steam trapped between the tread and the runway [15]. ‘Reverted’ rubber leaves distinctive white marks on the runway surface, where it fills the pores and produces a slick [6]. Incidentally, an overheated tyre may produce isoprene gas that ignites when it mixes with the pressurised oxygen inside so that the the tyre explodes. This is why modern tyres are usually inflated with an inert gas [15], and fitted with fusible plugs to relieve pressure if the temperature rises above a safe level.
When braking to a halt, the kinetic energy of the aircraft effectively disappears. So what happens to it? Earlier in Sections G0816 and C0816, we looked at this issue when analysing the behaviour of a road vehicle. Surprisingly perhaps, the answer lies in the brakes themselves. Aircraft brakes consist of multiple disks. Originally they were made of sintered metal, but often nowadays, they are made from carbon composite, which can absorb more heat per kilogram than steel. The disks act temporarily as a heat sink, glowing red hot but largely holding on to the energy until it can be dissipated gradually to the atmosphere later. It’s interesting to see how the disk brakes and anti-lock systems that are now routinely installed on modern automobiles were first developed for aircraft.
Figure 10
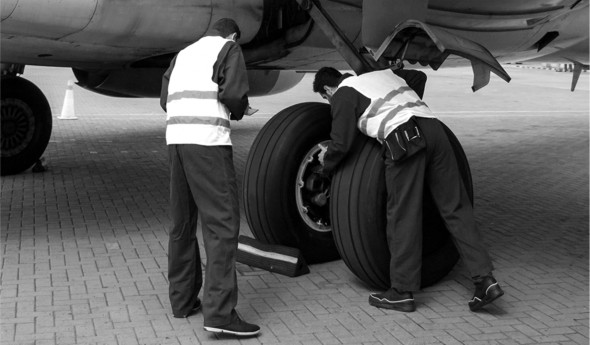
Figure 11
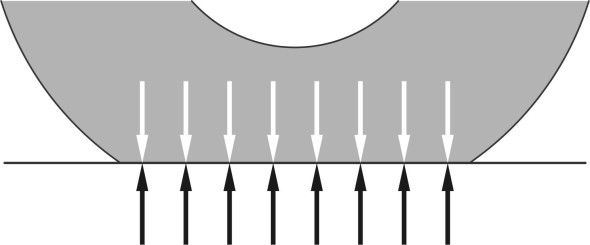
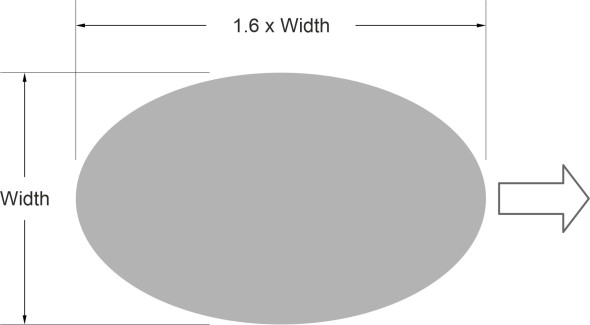
Finally, we can return to the tyres, on which the stability of the aircraft on the ground depends. Like most road vehicle tyres, aircraft tyres are of radial construction. But compared with truck tyres, they appear fat and bulbous, more rounded in cross-section, with little in the way of a tread pattern except circumferential grooves to dispel water: a complex tread pattern would be obliterated by scuffing along the runway during landing, weakening the structure. Typical examples are shown in figure 10. The ground staff are checking the tyre pressures, which are carefully monitored during service. The pressure in a typical aircraft tyre is much higher than that of a truck tyre, because it carries a much heavier load. To see how it does this, we need to look inside the tyre. Figure 11 shows part of the carcass in contact with the ground. If we treat the carcass as the skin of a balloon, the load acting on the inside of the contact patch must equal the load acting on the outside, which is simply the reaction from the wheel load. This requires (a) a high tyre pressure, and (b) a large contact patch. The latter arises from the large deflection where the tyre flattens on contact with the ground. As shown in figure 12, the deflection of a large aircraft tyre normally around 32%, and this leads to pressure waves forming in the tread as it leaves the contact area, in the same way as it does for car tyres [10]. Not much information is readily available on the shape of the contact patch, but the Boeing tyre maintenance manual refers to the US Corps of Engineer’s S-77-1 report, which takes the outline as an ellipse whose major axis is 1.6 times the minor axis (figure 13).
Figure 12

Figure 13
Conclusion
At this point, we are left with the aircraft on the ground with its weight resting on rubber tyres in the same way as any road vehicle. This brings to an end our study of the way moving vehicles interact with their surroundings, and we hope you have found it useful and enjoyed the journey. There are many other aspects to be explored, for example, the environmental noise and pollution brought about by transport vehicles, together with their wider contribution to ecological damage and climate change. These are now major sources of public concern, and to encourage discussion, we hope to introduce a bulletin board shortly. In the meantime, if you have found any of the foregoing material interesting/dull/misleading, please let us know.
Acknowledgements
Figure 10: Dunlop Aircraft Tyres web site ‘Why is aviation tire pressure maintenance so important?’ https://www.dunlopaircrafttyres.co.uk/technical/pressure/, accessed 02 June 2024, by kind permission of Dunlop Aircraft Tyres Ltd.